Calculating Bradford Factor on your absence data in TARGIT

What is the Bradford Factor?
When you analyze absence data, one of the most known theories is the Bradford Theory or Bradford Factor (https://en.wikipedia.org/wiki/Bradford_Factor) .
In short the theory says that the number of absent days is less critical than the number of absent periods (normally you look at a rolling 52-week period).
An example:
- Person A has one absent period which is 10 days long
- Person B has 4 absent periods – each 1 day long
The Bradford formula says:
Bradford Factor = Number of absent periods2 * Number of absent days
Person A formula:
1 * 1 * 10 = 10
Person B formula:
4 * 4 * 4 = 64
So even if Person A is much more absent than Person B, his Bradford score is still much lower, because all his absence was concentrated on one period.
The original theory contains indications on which scores are acceptable, which should result in warnings and which indications should result in firing people.
However, even if the full theory feels to rigid to implement, you can still benefit from the extra perspective on absence that becomes visible through calculating the Bradford Factor.
How to calculate Bradford factor in TARGIT?
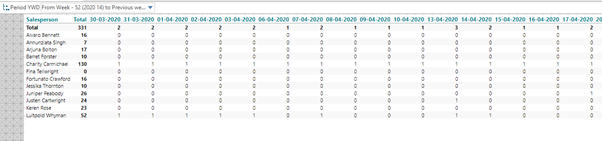
First we setup a cross table showing absent days by employees on the vertical axis, dates on the horizontal axis with a dynamic filter of rolling 52 weeks:
Now we need to calculate the number of absent periods for each person. We will need an intermediate calculation to do this.
We calculate a “flag” that indicates the beginning of an absence period. With a calculations (as a new measure) with this syntax:
If sum(0,0,m1)=1 and sum(-1,0,m1,0) = 0 then 1 else 0
It basically says – if the current date shows the person being absent – and the previous data shows no absence, then set the flag.
This will set a flag at the beginning of every absent period.
Note 1
- The second reference has 4 parameters sum(-1,0,m1,0).
In the very first date, there will be no previous date to check, and the 4th parameter in TARGIT syntax will insert a value when the reference fails to return a value.
In this case we insert a 0 which means that absence beginning on the very first date of the filter will be shown as 1.
Note 2
- In the example above there is also an underlying filter saying weekdays only (Monday-Friday). That solves the problem of weekends - which potentially could ruin the logic behind identifying absence periods.
Next we can add up the “flags” and a calculated column which will give us the number of absent periods.
Sum(all,0,m2)
This calculated column will have the column reference c1.
Let’s also make a calculated column that sums up all the absent days for each employee:
Sum(all,0,m1)
This calculated column will have the column reference c2.
Finally we can calculate the Bradford factor in another calculated column:
Sum(c1,0,m1)*sum(c1,0,m1)*sum(c2,0,m1)
Now you have the Bradford Factor for each employee to supplement your general Absence Analysis.
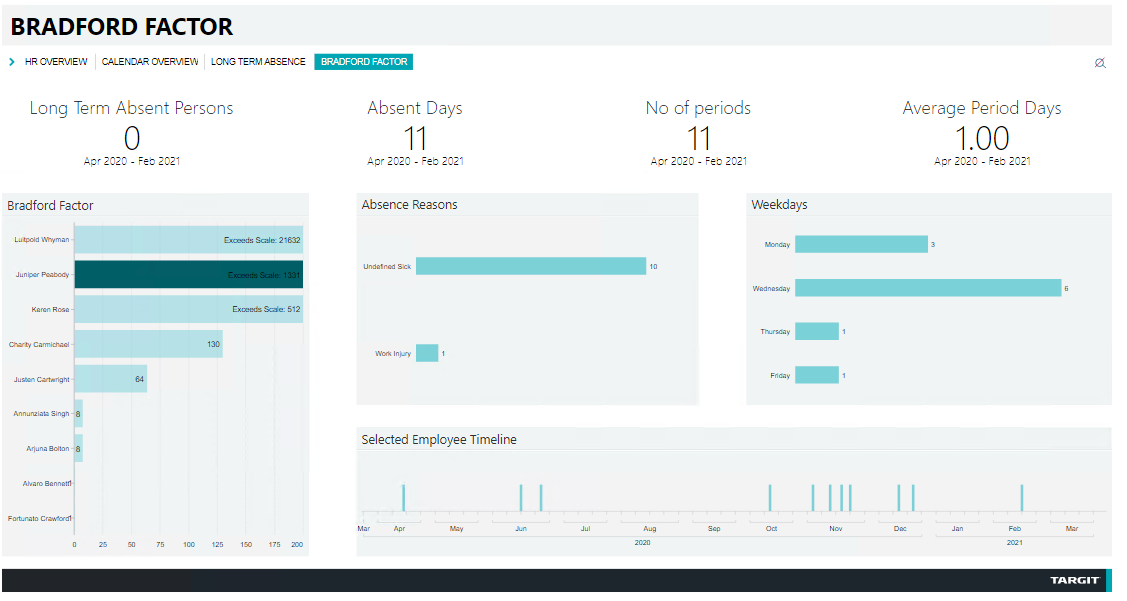
Based on this initial work, you can build a dashboard like this: https://solutions.targit.com/default.aspx?doc=vfs://Global/TARGIT%20Demo/HR/Bradford%20Factor.xview.
Comments
2 comments