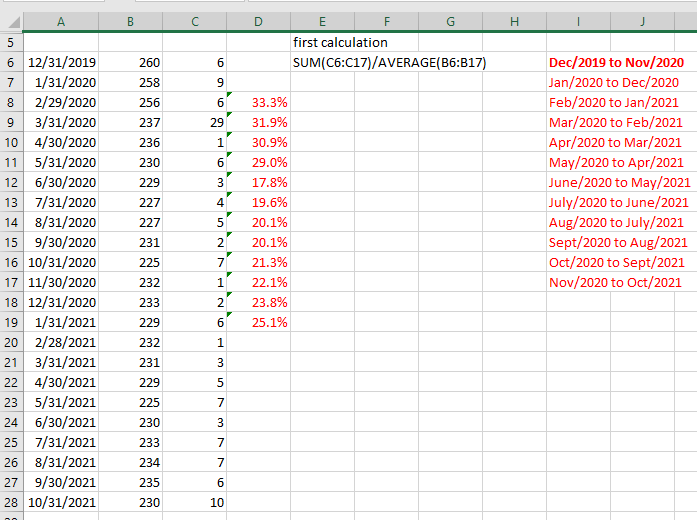
Rolling 12 months by grouping it 12 times and calculate 12 months = sum(m2)/avg(m1)
Hi All,
I have a report that has rolling 12 months = sum(m2)/avg(m1) using current month as Nov. 2021 and it happens 12 times preceding the next previous month until we are at previous month Dec. 2019 to previous 12 months Nov. 2020
So I need, for a month, the average for the previous 12months. And I need that for a rolling 12 period but not having much luck. Does anyone have an input?
Thanks,
Betty
0
Comments
Hi Betty
If I understand you correctly, your rolling average is looking forward and not back?
And you need to make a sum of a certain measure for current month to 11 months forward and divide it by the average of another measure for current month to 11 months forward?
With these assumptions, your formula could be:
sum(d1,0:11,m1)/avg(d1,0:11,m2)
0 means the current and 11 means 11 ahead from the current.
You need to include all months in the filter for the calculations to be correct, and then use visibility to hide the last 12 months.
Hope it makes sense :-)
br/Niels
Hi Niels,
Thank you for your suggestion! The data needs to be dynamic and created a new user dimension that rolls the 12 months as time passes every month. It took a lot of tweaking new measures to create the graph I needed starting with the formula below.
if sum(0, 0(l(1,0,0)), m2, 0) = 0 and sum(0, 0(l(1,0,0)), m1, 0) = 0 and (sum(0, 0(l(1,0,0)), m1, 0) / count(0, all(s), m2, 0)) = 0 then 0 else sum(0, 0(l(1,0,0)), m2, 0) / (sum(0, 0(l(1,0,0)), m1, 0) / count(0, all(s), m2, 0))
Appreciate your input!
Thanks,
Betty
Please sign in to leave a comment.