Average calculation for children in hierarchy
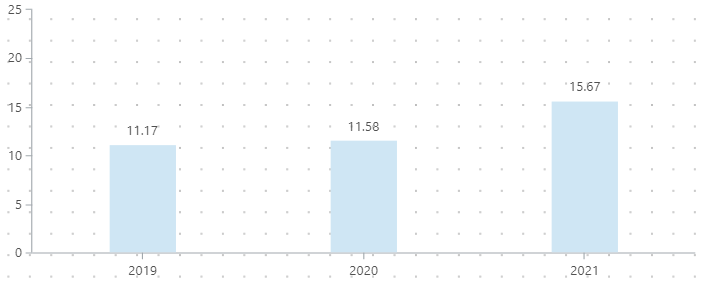
I want to create a bar char showing average number of cases per month for each year. For example:
139 reported cases YTD Dec. 2020 = 139 / 12 = 11,58 average cases per month
94 reported cases YTD Jun. 2021 = 94 / 6 = 15,67 average cases per month
I have used this formula in Targit: avg(d1, all(c), m1), which gives me the following result:
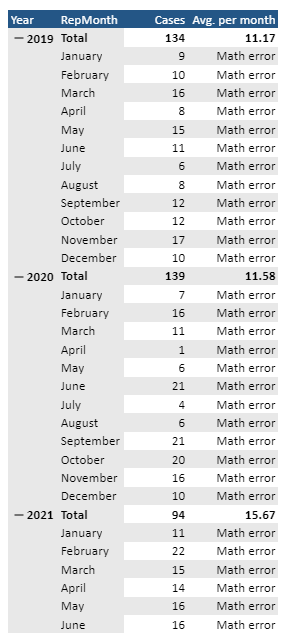
The caluclations are correct, but when i collapse the hierarchy (as i only want to report the yearly average) i get a math error:
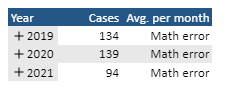
How can i fix this? I am guessing i need to add some parameters to my formula? This is the desired result:
0
Comments
Hi Thomas
In TARGIT you can't really calculate on a level of a hierarchy, unless that level is expanded. That's why you get the math error.
You could try and hide the months - but that would just lead to another problem - TARGIT visualizations don't include subtotals (which the years would be if your hierarchy was expanded to month level)
The easiest solution would require a little different setup.
I would avoid using the hierarchy, and instead just put an attribute on each axis as shown below.
In this table I've added the attribute Year on the vertical axis and Month on the Horisontal axis. (the measure is not important - could be anything)
Now I can just a a calculated column with the syntax avg(all,0,m1)
Then I can go to visibility in the properties section and hide my original measure - in my case Invoice Cost (by unchecking it)
Now I have only this left:
And I can visualize it easiliy:
hope it makes sense :-)
Hi Niels
Thank you for your solution - it works as intended given you have data for all months, but not if you have any "gaps" in the data :-)
In my global date criteria, i have selected from January 2019 to June 2021. That means i want to calcualted the average for 2019 and 2020 based on 12 months of data and the average for 2021 based on six months of data. The report is developed every six months, that is why i need to able to compare full year figures with half a year.
As you can see in the example above, your solution for fx. 2019 gives an average of 2,57 as it takes the grand total of 18 and divides it by the seven months of actual data. However, i want it to take the grand total of 18 and divide it by every single month (12) which would give me an average of 1,50 instead.
Is there any way i can overcome this obstacle?
/Thomas
Yes there is a way - if want to do an average off all the months - regardless if they hold any values, you might just make a formula like:
sum(all,0,m1)/12
however - what if you don't always have 12 months in your table - then there's a more refined version here:
sum(all,0,m1)/allcount(all,0,m1)
Allcount will count all the cells in each row and divide by that number - so the calculation will be robust with any number of months in the crosstab.
Hi again Niels
You solution above is working, however not if you want to compare half a year against a full year.
As you can see in my global criteria, i want to compare the full year average for 2019 and 2020 to the first six months of 2021:
Is there any way to make the formula variable depending on how many months is included in the global criteria?
/Thomas
Please sign in to leave a comment.