Let us assume that we have a set of source data that hasn’t been so nicely formatted as we have seen so far. If possible, we would like to have data delivered in the “rows equals transactions and columns equals dimension attributes or measures” fashion, but sometimes this is not the case.
Especially when working with data coming from Excel sheets, you may experience data in the pivoted format, where dimension values have been added to both axes to form a grid of transactions rather than just a list of transactions.
Before such data can be useful to TARGIT Data Discovery, we will need to un-pivot the data.
To illustrate this, we can modify the previous crosstab to work with the two dimensions on separate axes:
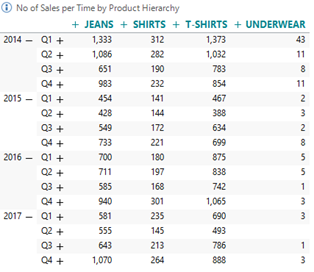
These are the exact same data as we looked at previously – now just in a pivoted mode.
If we save this analysis with a new name and add it as a data source to Data Discovery we can see that the current format is not useful. If we continued from here, Jeans, Shorts, T-Shirts and Underwear would be treated as four separate dimensions or measures rather than just one dimension with four different dimension members.
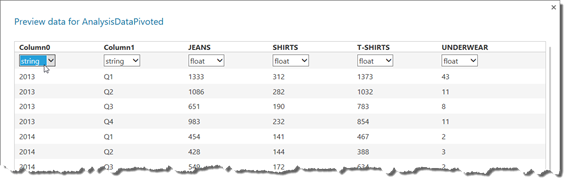
Important: In this example, we will need to change the data type for years to string before proceeding.
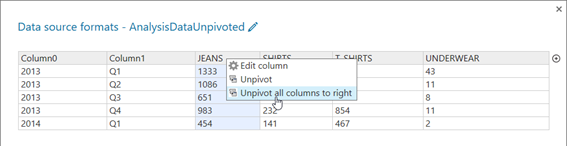
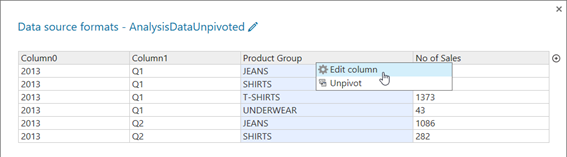
To un-pivot these data, we will have to create a new Format for the data source. All the columns Jeans, Shirts, T-Shirts and Underwear should be un-pivoted to the vertical axis. The easiest way to do this, is to right click the first column that should be un-pivoted, and then choose to un-pivot all columns to the right.
This should produce an un-pivoted result like this:
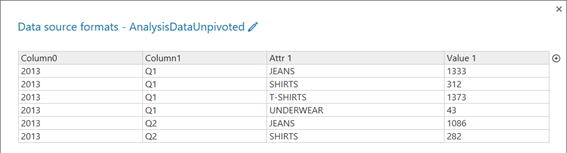
Before saving the Format, we may want to rename the last two columns. Right click to rename.
Comments
Please sign in to leave a comment.