In this example we will look into how to bringe live, dynamic weather forecasts into your dashboards. We will be using Web Box objects for that.
The example is based on weather data supplied by the Danish Meteorological Institute (DMI, http://dmi.dk), thus the dashboard has been designed with a Danish interface. Still, the principles used should be clear and useful, even to a non Danish speaking audience.
Finding the right URLs
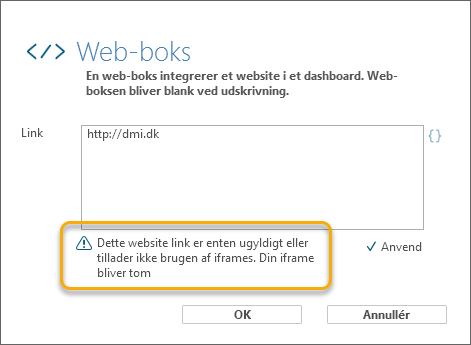
First, you need to make sure that a URL to a web page is compliant with embedding in an iFrame. For instance, the normal URL to DMI, http://dmi.dk, does not work. If you try to insert it into a Web Box and click the Apply (Anvend) button, you will get a warning that it will not work and that web box will remain empty.
So I did a little research on the Internet and found that you could retrieve DMI weather forecasts with these URLs, that all comply with iFrame embedding:
- Next 2 days forecast: https://servlet.dmi.dk/byvejr/servlet/byvejr_dag1?by=9000&mode=long
- 3-9 days forecast: http://servlet.dmi.dk/byvejr/servlet/byvejr?by=9000&tabel=dag3_9
- 10-15 days forecast: http://servlet.dmi.dk/byvejr/servlet/byvejr?by=9000&tabel=dag10_15
Notice that the "by=9000" in these examples specifies the zip code 9000, which is the zip code of Aalborg - the location of TARGIT HQ.
If you just insert these URLs in three separate Web Box objects, you will get something like this:
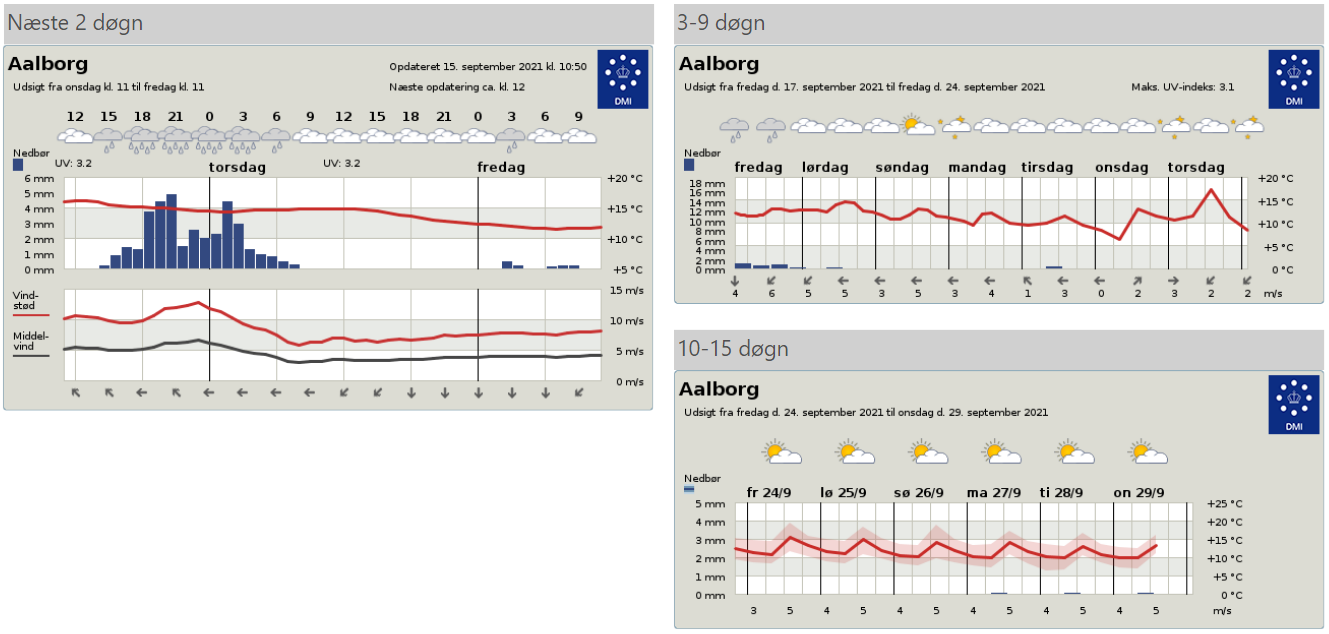
Of course, you can replace the zip code with the zip code of your own home town to get your own, local weather forecasts.
Every time the dashboard is loaded or refreshed, the web box content is also reloaded. So if a new weather forecast has become available in the meantime, it will automatically show.
Make the URLs dynamic
Now, the next step is not necessarily something you need to do. If your requirement is to show weather forecasts for just a single location, then you just need to set the correct zip code in the above URLs.
However, I took it a step further. I Googled, found and downloaded a CSV file with information about Danish zip codes, including their location names. I also added this CSV file to Data Discovery and ended up with something like this:
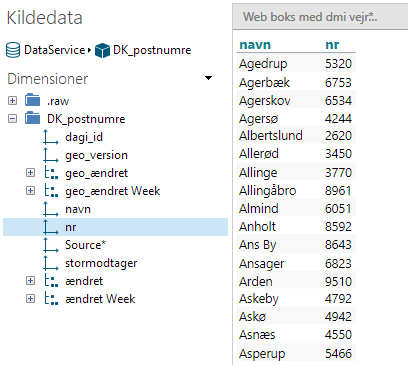
Now I can actually use this table as a slicer - applying the zip code as a drill down filter on my web boxes.
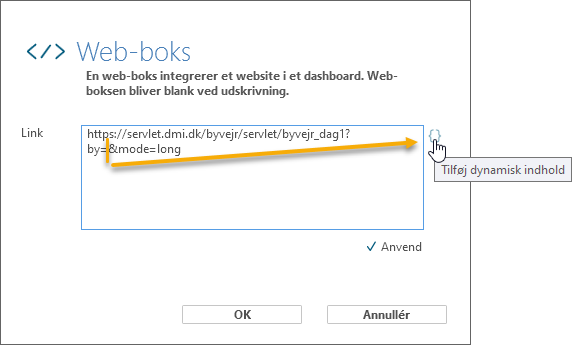
In my web boxes, all three of them, I replaced the static zip code with dynamic content:
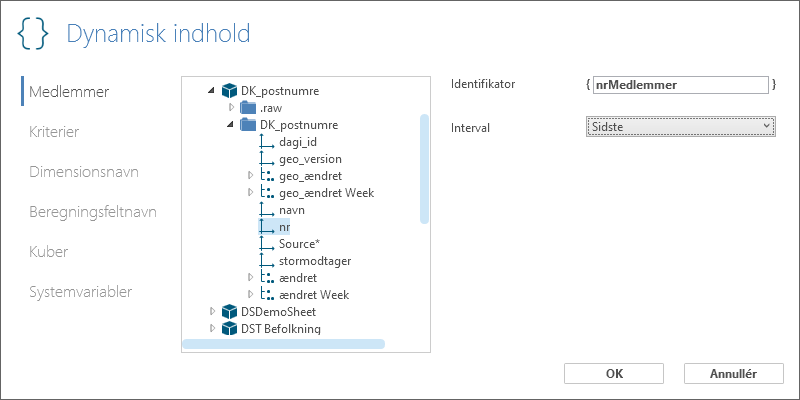
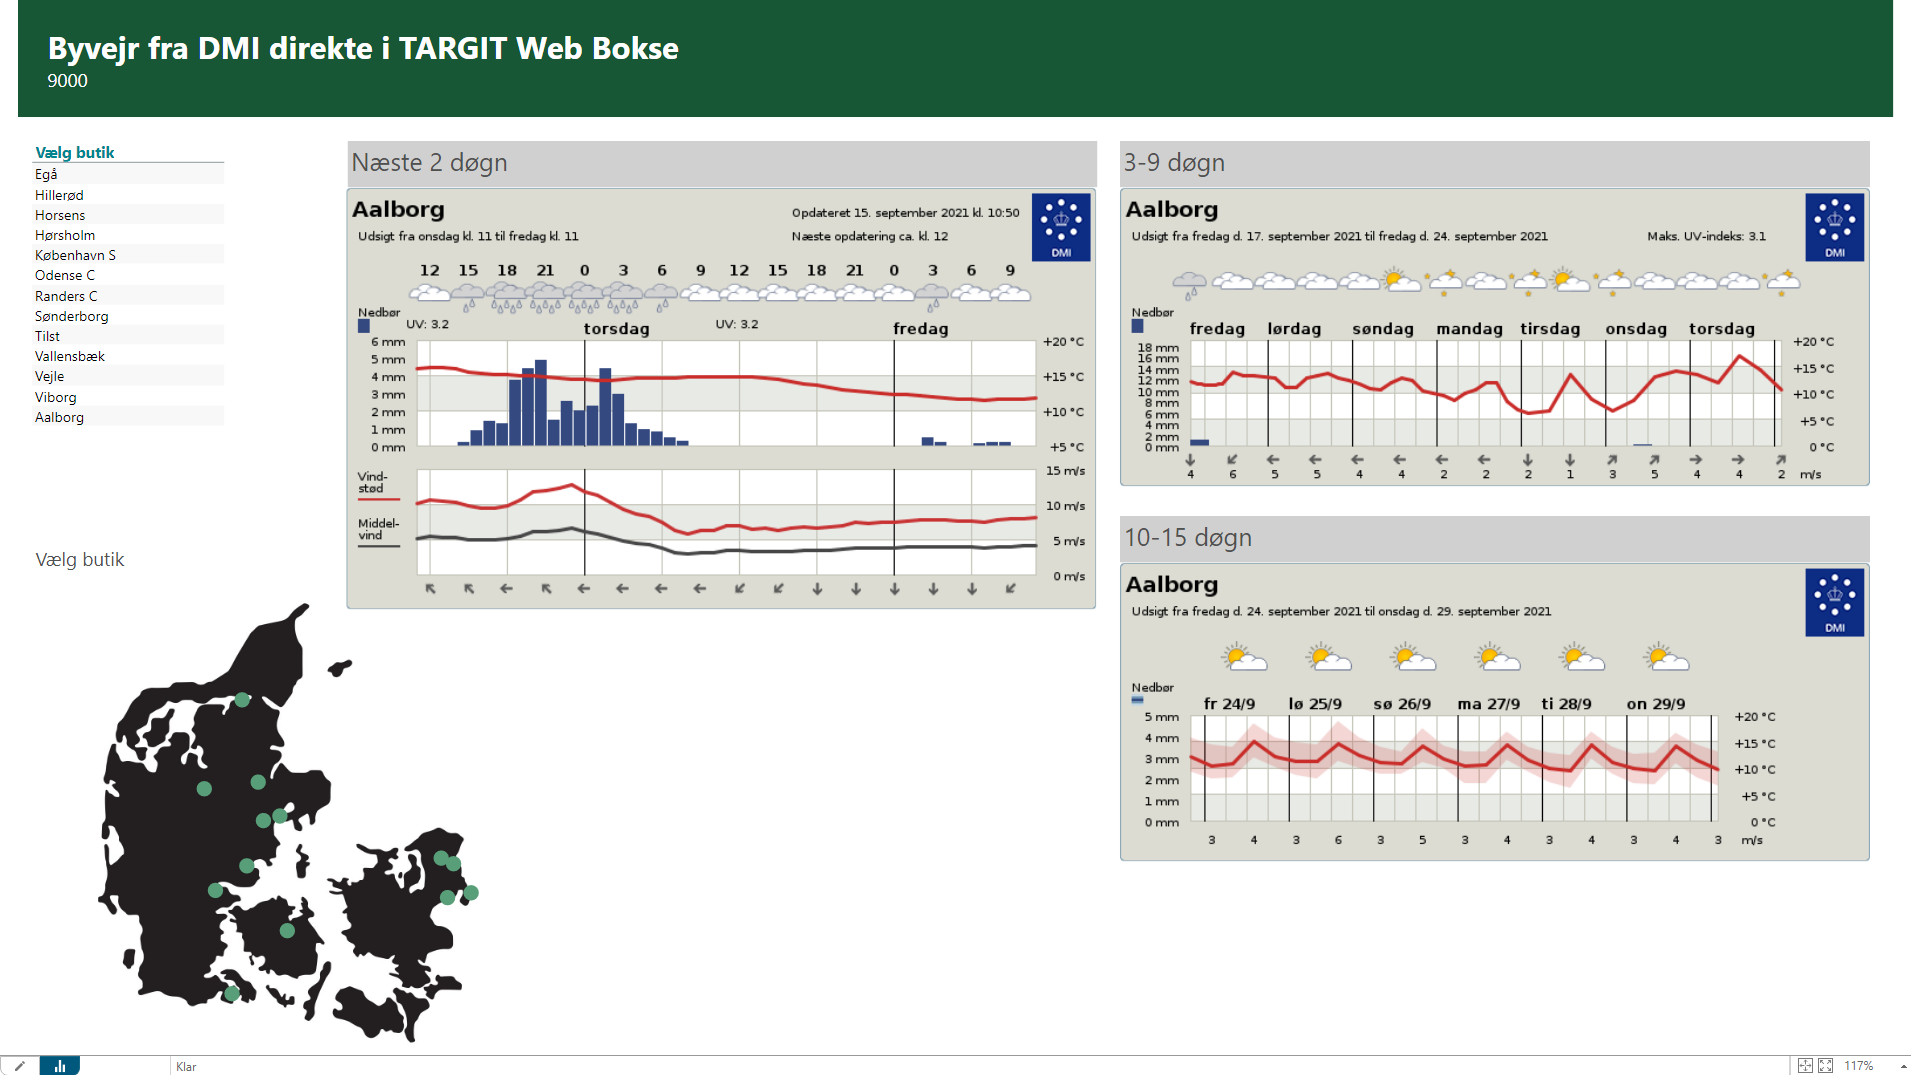
In my final dasboard I filtered my locations to about a dozen locations, and furthermore added a header and a map to the dashboard.
Without any selected location (shows the Last/Sidste member, Aalborg):
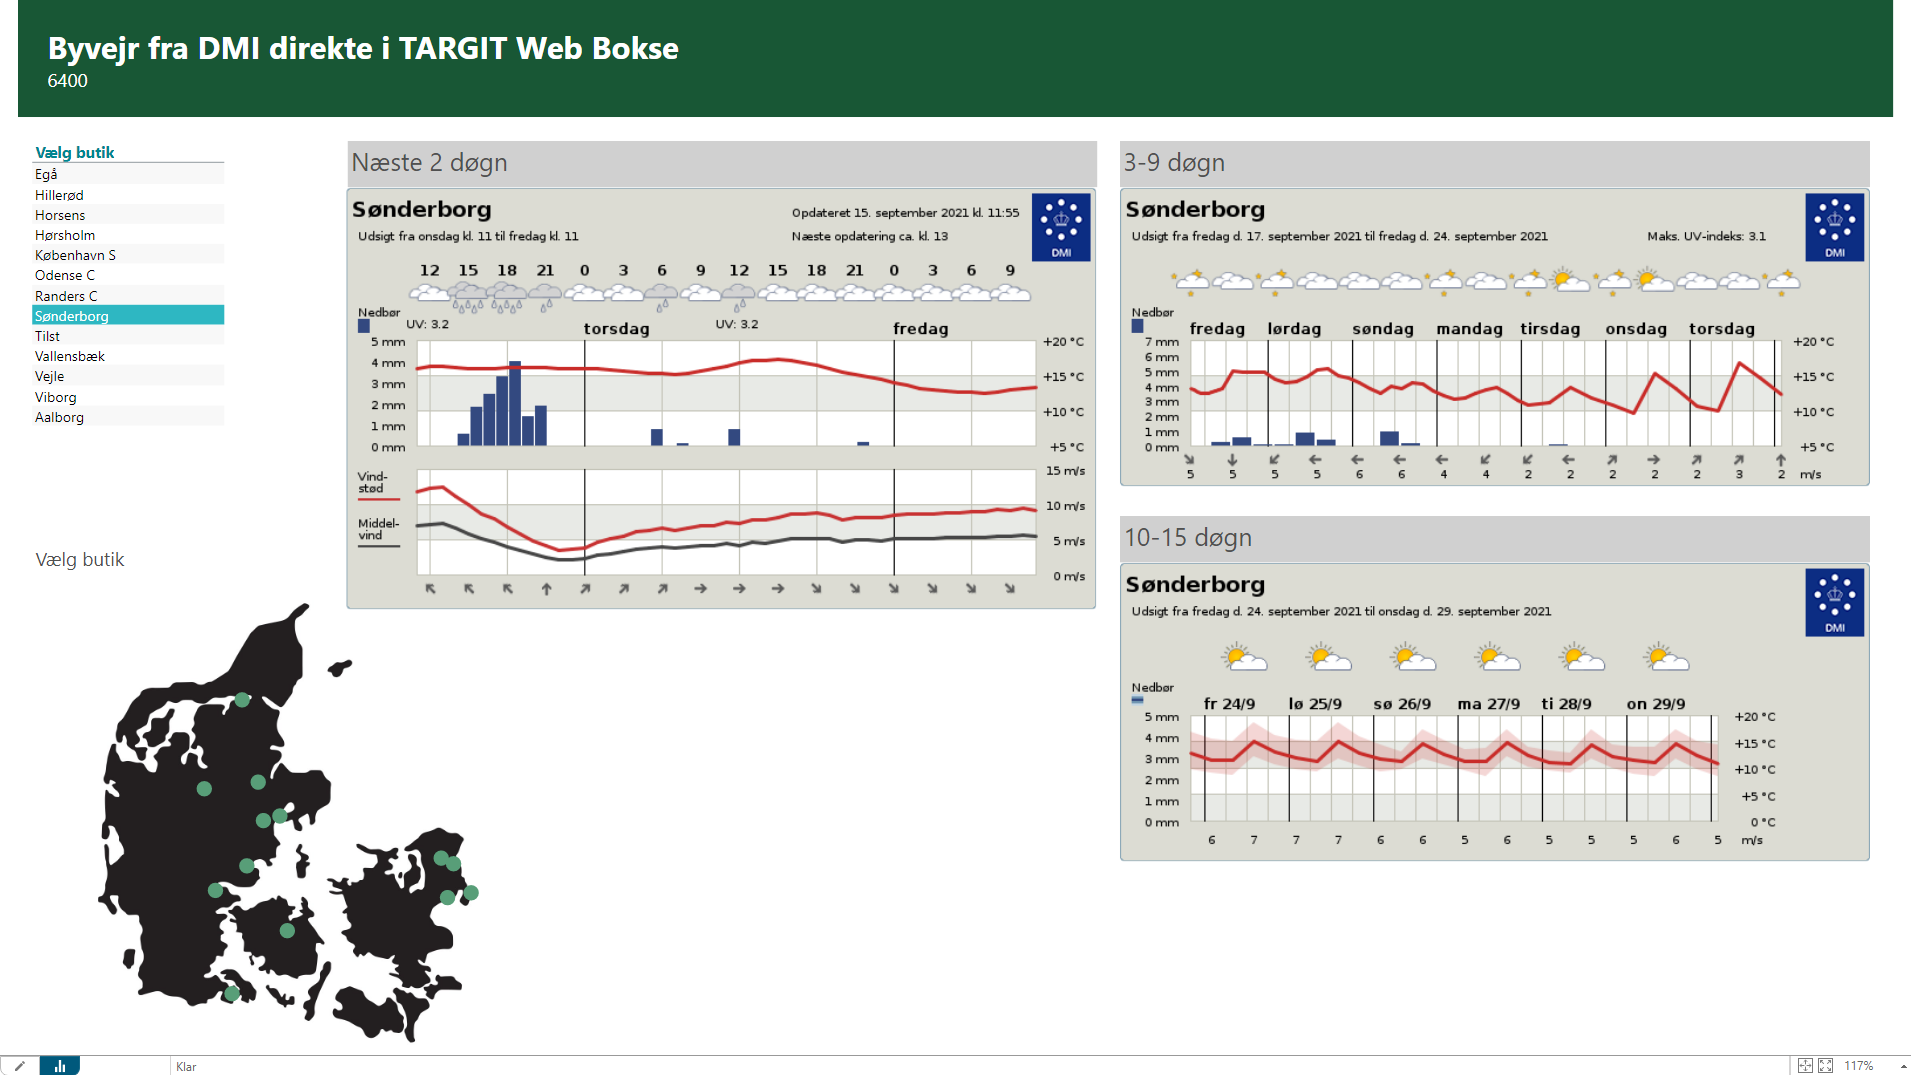
Filtered on 'Sønderborg' from the table:
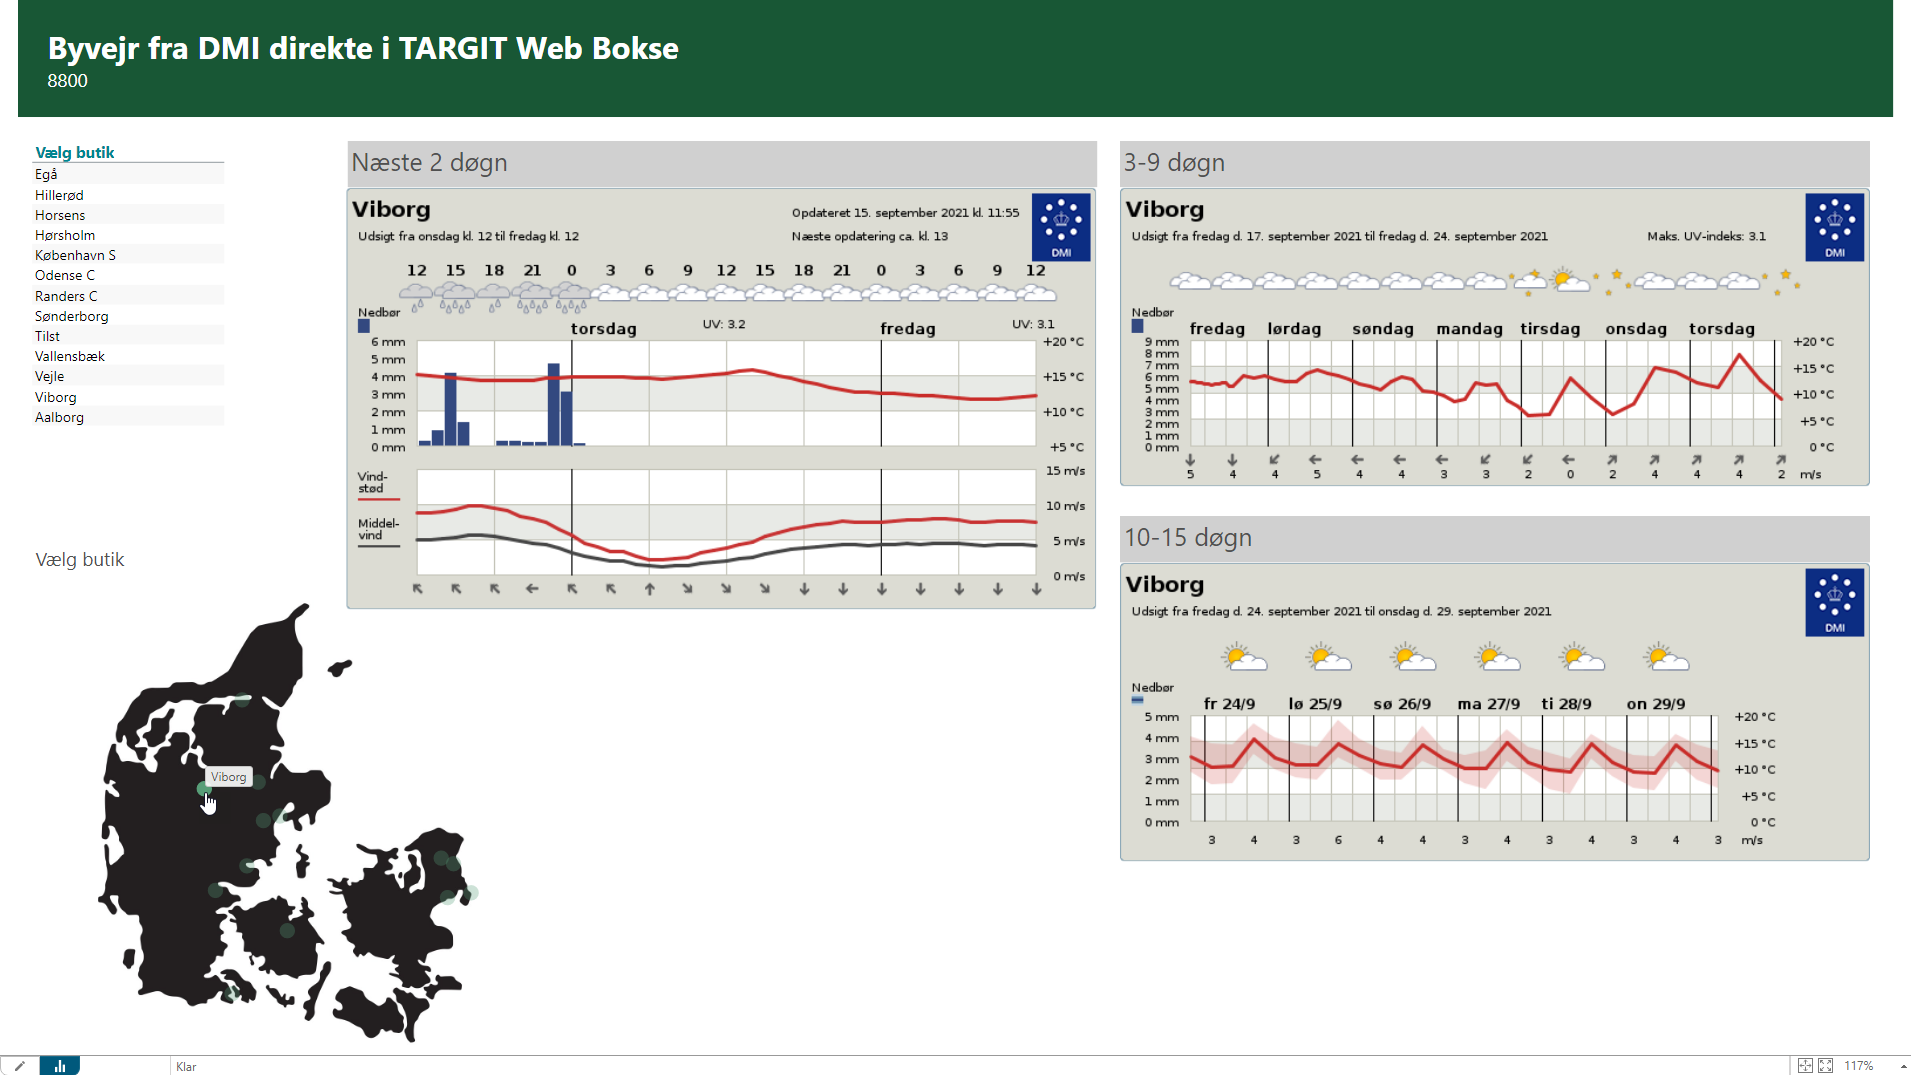
Filtered on 'Viborg' from the map:
Comments
Any idea how to auto play and loop a youtube video? Is there a parameter I can add to the url?
In the iframe code from youtube i see a parameter:
allow="accelerometer; autoplay; clipboard-write; encrypted-media; gyroscope; picture-in-picture"
so how to add the allow="autoplay" to my url in order for my video to start playing when dashboard opens.
note: adding ?autoplay=1 to end of url does not work
The iframe code looks like eg:
<iframe width="833" height="469" src="https://www.youtube.com/embed/JcBy35mIt9I" title="YouTube video player" frameborder="0" allow="accelerometer; autoplay; clipboard-write; encrypted-media; gyroscope; picture-in-picture" allowfullscreen></iframe>
Please sign in to leave a comment.