TARGIT Data Discovery may work with multiple, related data sources. The data sources do not need to come from the same source or to be of the same type or same format – in fact, as long as TARGIT Data Discovery is able to read the data, these data can be mashed up to fulfill any analytical needs.
To perform a successful data mashup, you will still need to be able to relate data from different to each other. This relation requires common keys across the data sources to be mashed up.
Looking at the DSDemoSheet cube, we notice that some of the dimensions, e.g. the Salesperson Code dimension only contain the salespersons’ initials.
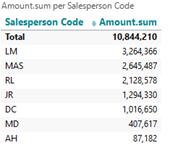
Suppose that we actually had information about these salespersons’ real names, but in a separate data source. Then, by mashing up these new data with data from the original DSDemoSheet data source, we will be able to enrich the Salesperson dimension.
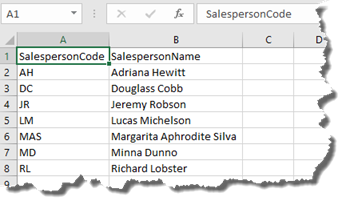
The additional information with Salesperson names is located in a separate Excel sheet in the same folder as the DSDemoSheet file:
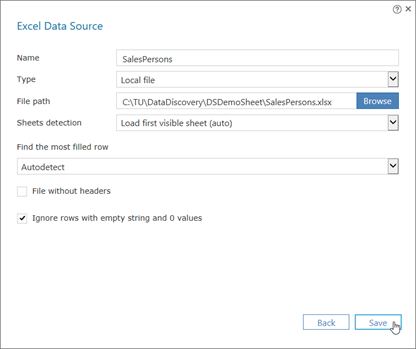
First, we will need to add this extra Excel sheet as a new Data Source to TARGIT Data Discovery.
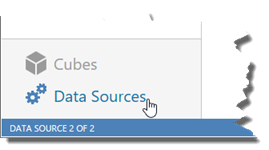
Open the Data Modeler, and go to the Data Sources tab:
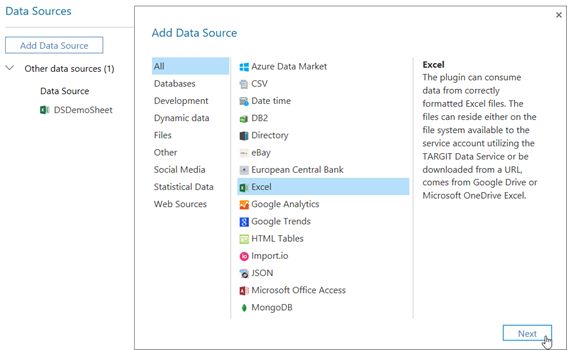
Click the “Add Data Source” button and select an Excel type data source:
Set up properties for loading data from the new Excel data source:
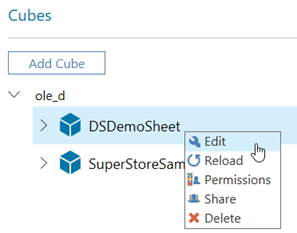
Now we will need to open the Cube Designer, either as a new cube or for an existing cube. In this case we will edit the existing DSDemoSheet cube:
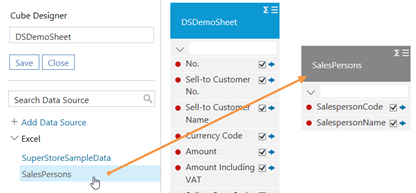
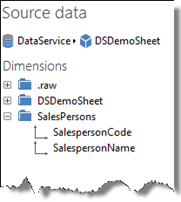
On the left hand side of the Cube Designer, the available Data Sources are arranged by type. Add the new Excel SalesPersons data source to the model by dragging in the table.
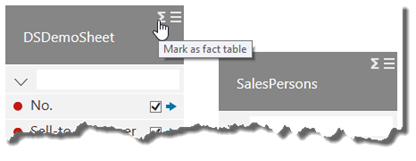
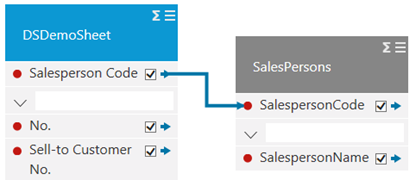
Notice the different colors of the two tables. The blue color indicates that the DSDemoSheet table has been marked as a fact table. All tables containing measures should be marked as fact tables. Clicking the Sigma sign on top of each table will toggle between fact table and dimension table.
Finally, we will need to set up the correct relation between those two tables. The tables are related by the Salesperson Code. Create the relation by dragging from the blue arrow in the fact table to the red dot in the dimension table.
At this point, the cube is ready to be saved. If it is a new cube, you will need to provide a cube name before you can save it.
Notice that Data Discovery automatically creates a Display Folder for each data source in your cube:
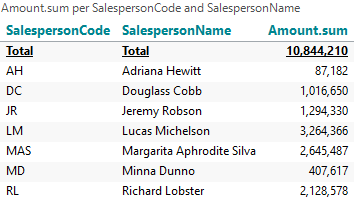
Now it should be possible to create analyses with enriched information about Salespersons’ names:
Comments
Please sign in to leave a comment.