Out of the box, TARGIT can calculate the Median from the current data set in any of your objects.
However, if you need to group your data into sections or periods of data and want to calculate a separate Median for each of those sections/periods, then you will need to do some extra work.
In the following example I am looking at a full year of data on the Week level:
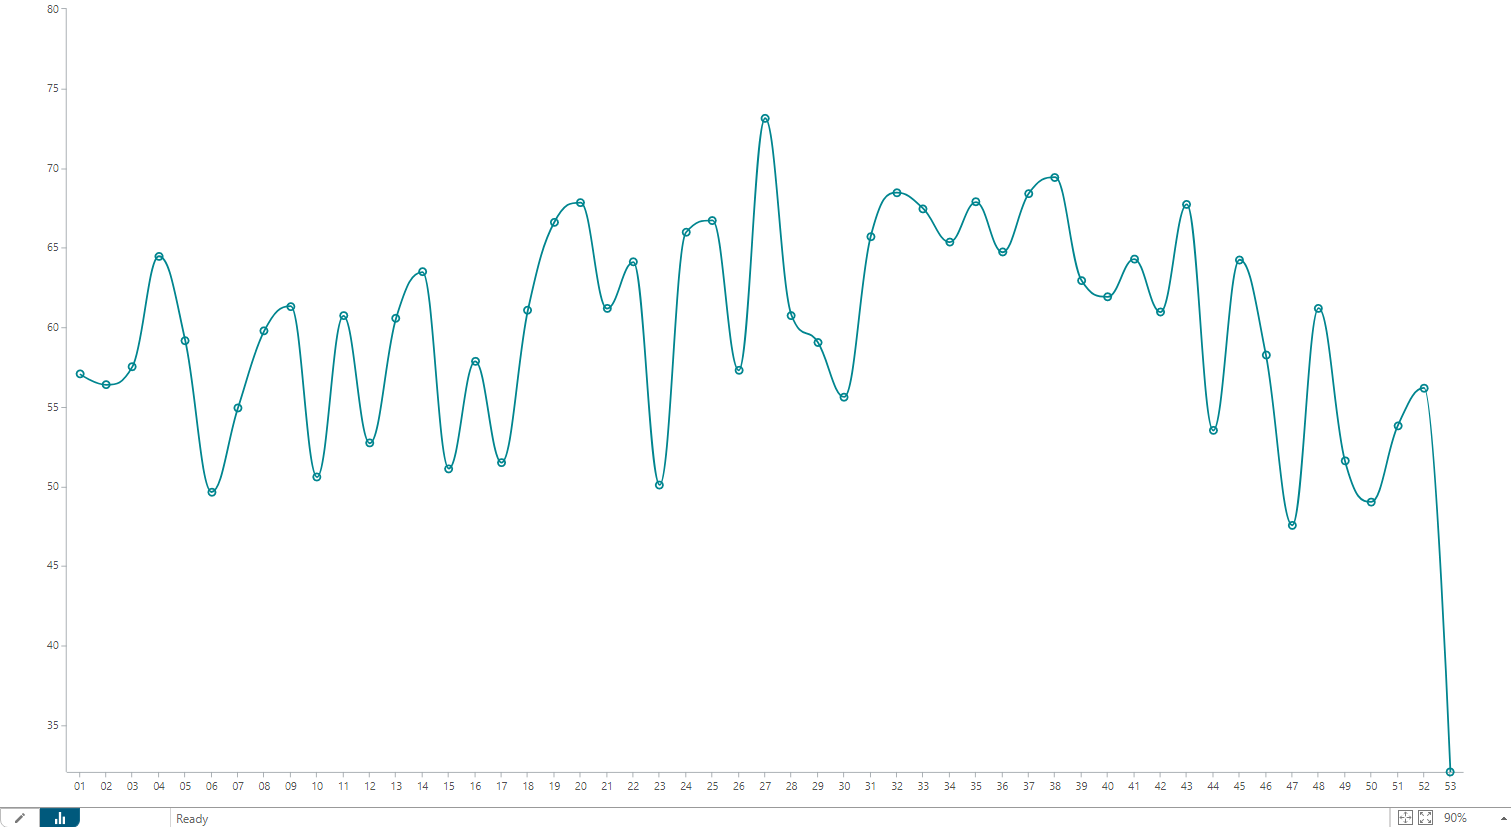
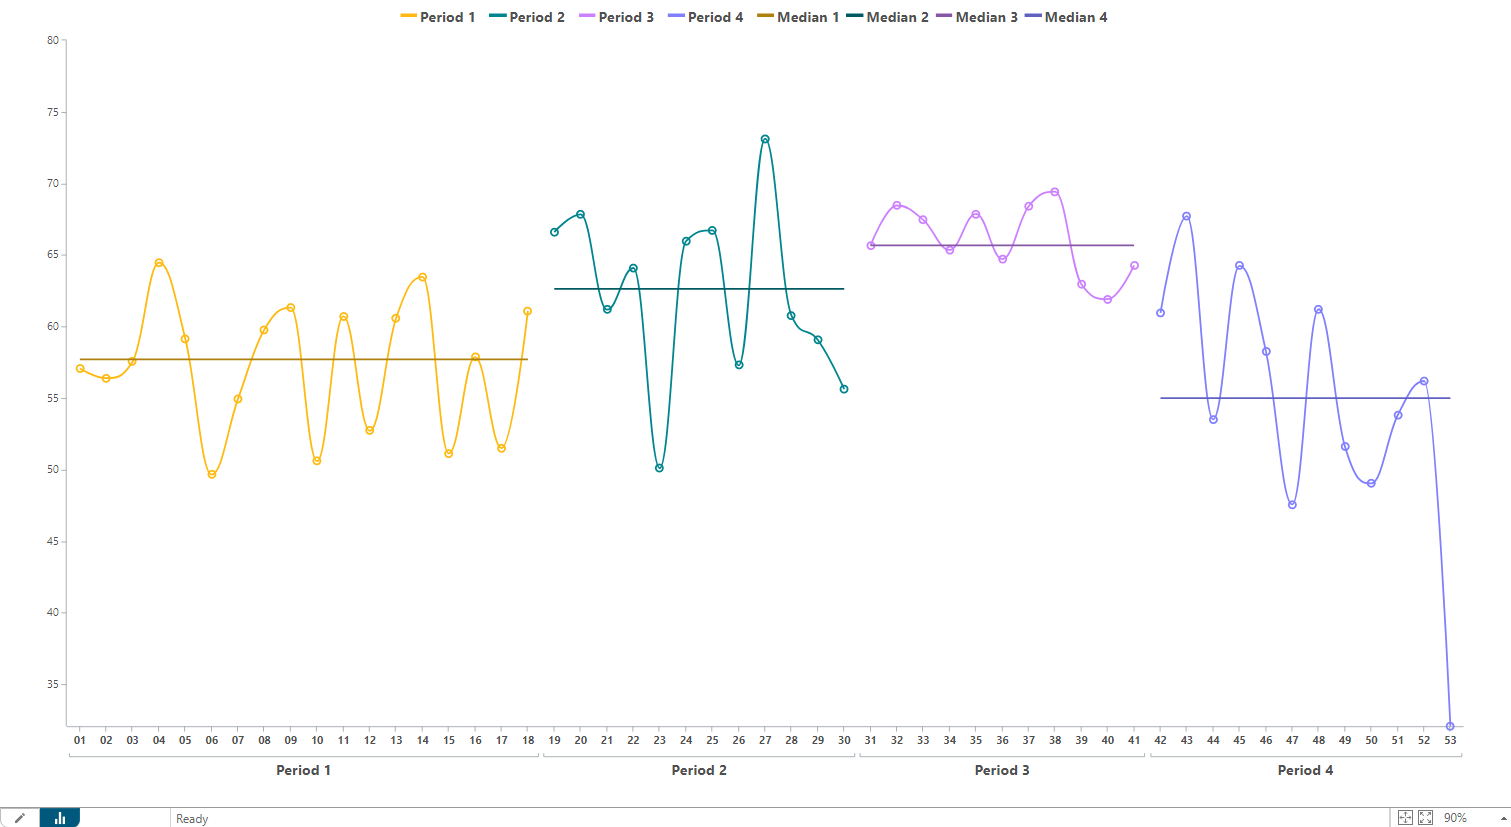
I am interested in the Median - not for the full year, but instead for four user defined week ranges. In fact, the result I would like to achieve is this:
To get to a result like this, I will need to work with the following TARGIT features:
- A User Dimension with four members
- Two calculations for each period - one for copying the original measure and one for the Median calculation
- Two visibility agents for each period and Visibility in general
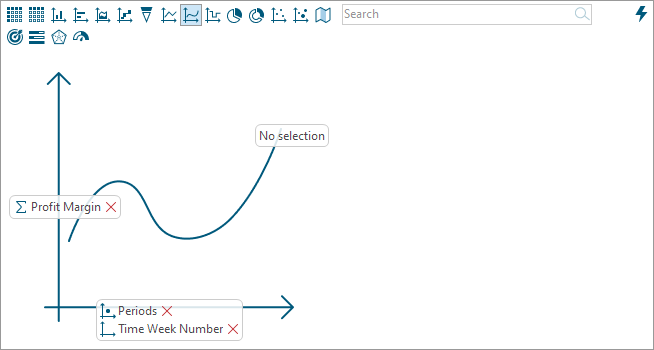
The User Dimension
You add the User Dimension from the Tools ribbon or from the Source Data Smartpad. The User Dimension in my example is made up from four User Dimension members: Period 1 through Period 4.
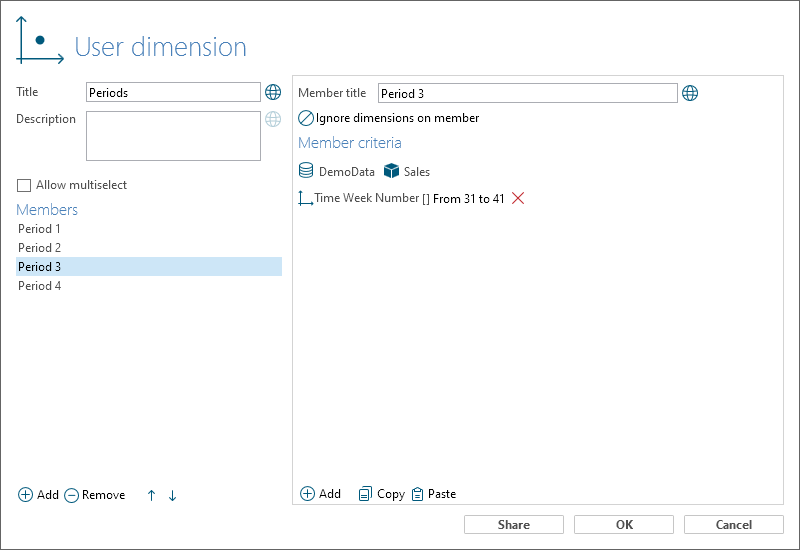
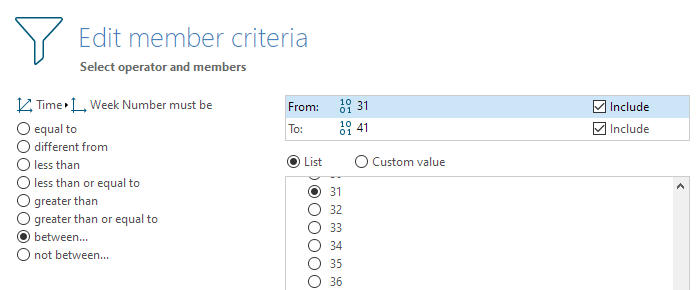
In this case, each member is made with a 'between' operator to define the week range for each period.
I am carefully placing the User Dimension on the same axis as my Week dimension - in front of the Week dimension:
Having done this, you should be able to achieve something like this:
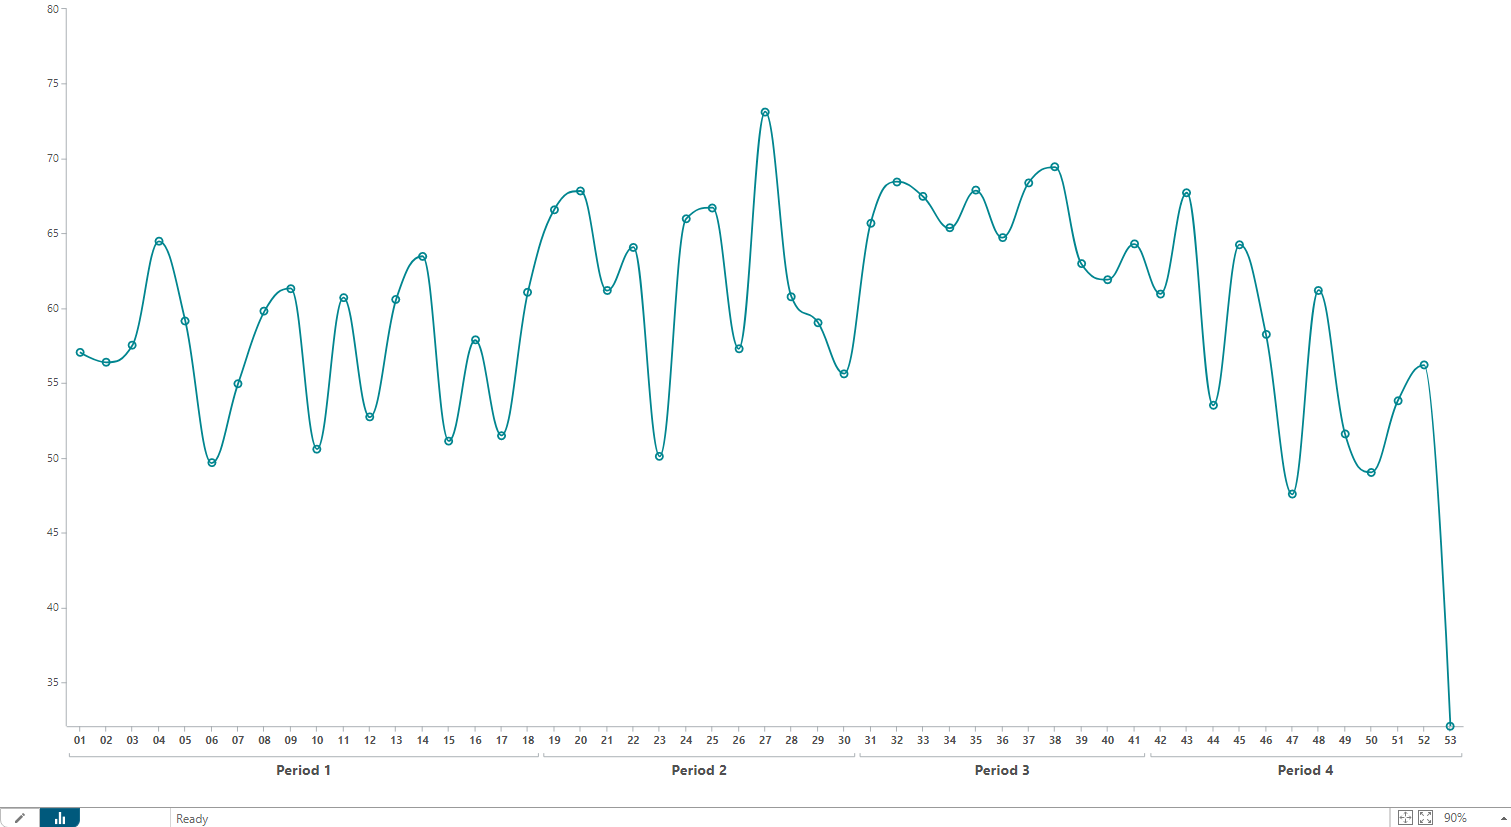
Visually, it gives a nice presentation of these user defined periods. Furthermore, we have produced a kind of hierarchy - with Periods and Weeks as the two levels - which is necessary in order to produce individual Median lines for each period.
Calculations
Next thing is adding a number of calculations.
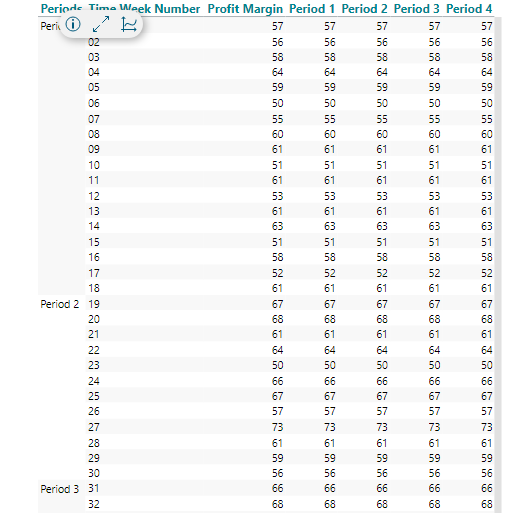
The first four calculations, which I will call Period 1, Period 2, Period 3 and Period 4 will all just copy the original measure into a new calculated column (insert each calculation 'as a single column'). The syntax for all four calculations is this:
sum(d1, 0, m1)
In the crosstab behind the chart, it will look something like this:
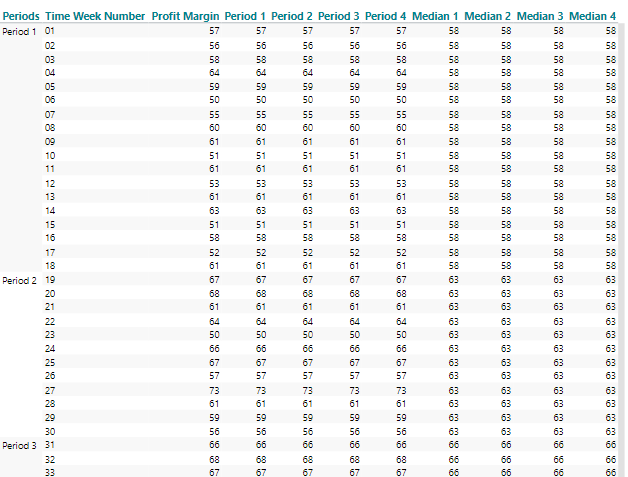
Likewise, we will add four separate Median calculations. Again, the syntax is identical for all four calculations:
median(d1, all(s), m1)
We are using the 'Siblings' modifier to get the correct Median for each period - that's why it was important to create a kind of hierarchy with the User Dimension.
In the crosstab behind the chart, it will now look something like this:
Why is it necessary to produce the same calculation four times? Well, this is necessary when we want to present the lines as disconnected lines. Otherwise, the Median line would like one connected line, however on different levels according to the periods.
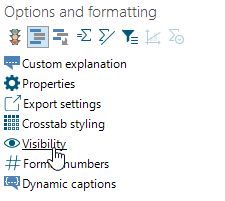
Visibility
Now we are going to hide most of our data to get to the visual presentation that we require.
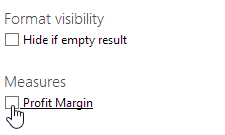
First, from the general Visibility option in the Properties Smartpad, we will hide the original measure - in my example the Profit Margin measure:
Next, we will add a number of Visibility Agents to make sure that the Period and Median calculations are only showing data within their corresponding User Dimension periods.
For that, we are going to use this calculation:
allcount(d1, d1:0(l(1,0)), m1)
If we added this calculation as a calculated column to our crosstab, we would see that it makes a count on the first level (the User Dimension periods level). So all rows belonging to Period 1will count '1', all rows belonging to Period 2 will count '2' etc.
By adding this syntax to a visibility agent (hide value) for our Period 1 and Median 1 calculations, we can ensure that all values not in the current period are hidden. Here, an example of the visibility agent on the Period 1 calculation:
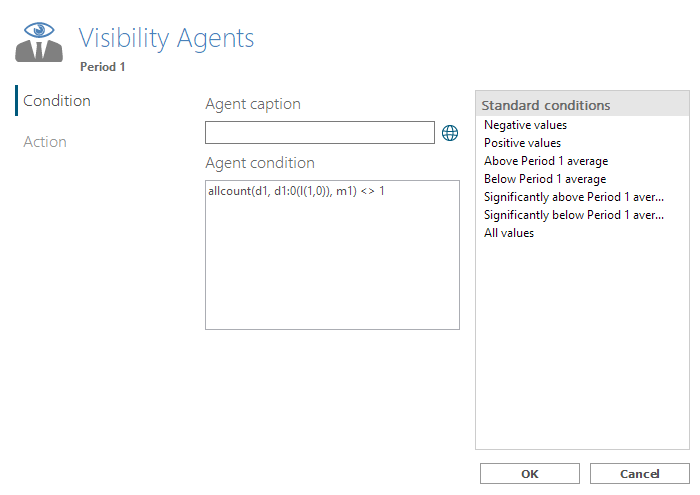
(Notice: The action is to 'Hide value'.)
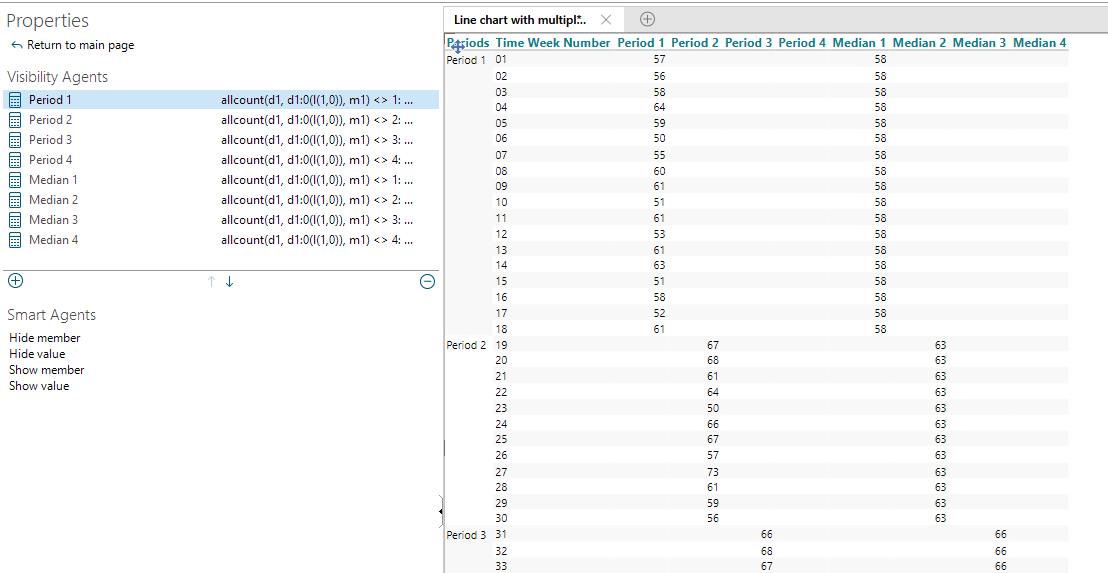
The condition for the visibility agent for Period 2 and Median 2 should then be:
allcount(d1, d1:0(l(1,0)), m1) <> 2
Etc.
All in all, in this example, we will end up with eight visibility agents, resulting in a crosstab like this:
And, when transformed into a chart, we get this:
Comments
Dear Ole
Thank you for this thorough example. I have a slightly different setup, which I have tried to work though the same process.
Unfortunately, I did not find the solution.
Can you help explaining this variant of the problem? I need the median of the indicator values for the active period (udrret aktiv) only.
The median is calculated as sum(c1,all(v),m1), but still all 24 rows are included in the calculation. I also tried the “sibling” syntax, but my time hierarchy differs from your example. “u-ret aktiv-suspenderet psyk” is a user defined dimension.
Thanks in advance, Kamma
Hi Kamma,
I am not sure we can resolve your challenge in any meaningful way.
If you want to use the Median calculation with the visibility modifier (v), you will need to 'Hide member' - not just to 'Hide value'. Imagine that you sorted your data by the column where some of the values were hidden; all the dimension members would still be there, but the Median (the middle member) would probably be the same as if all values were visible.
However, in your case I am not sure that you actually want to do that - because that would fully hide the six months with the "suspended" status.
Those are the limitations of the Median calculation: Either you do it on the full data set, or you do it on a data set with hidden members, or you do it with the siblings modifier within a hierarchy (as in my example).
If you put your 'u-ret aktiv-susp...' dimension in front of your time dimension, you will get the required siblings hierarchy, but I think it will spoil the whole purpose of your crosstab.
BR / Ole
Please sign in to leave a comment.