By default, a data object will display all the available information from the measures and dimensions that have been used to define the object.
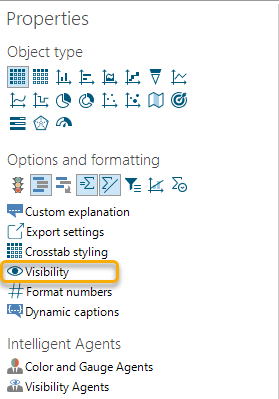
From the Properties Smartpad, you can use the Visibility option to hide/show a number of elements from the object.
Show/Hide standard elements
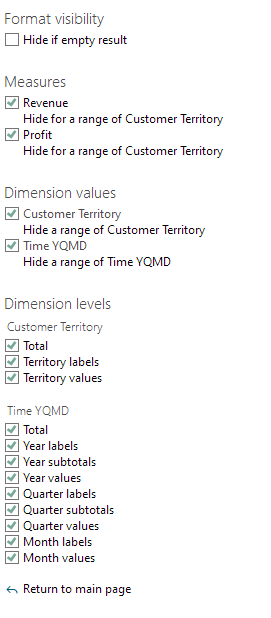
The list of options will depend on which measures and dimensions you have used to design the object from. The checkmarks will then either show or hide each of the elements from the list.
I recommend trying out these options with a crosstab at first. While the settings will have an effect on charts as well, it is not always obvious what the effect is - if any.
Notice: Hiding values on the lowest level (the Month values in above example) will result in seeing only subtotals and totals on the upper levels in a crosstab. However, a chart will not be able to display anything if you hide values on the lowest level.
Hide for a range
This setting can be used to hide measures for a range of dimension members on the horizontal axis.
Typically, if you have two measures - Revenue and Revenue Goal - and three years - 2019, 2020 and 2021 - on the horizontal axis, then you might want to hide the Revenue Goal in the first two columns and only show it in the last columns. Likewise, Revenue should be shown only in the first two column while be kept hidden in the last column.
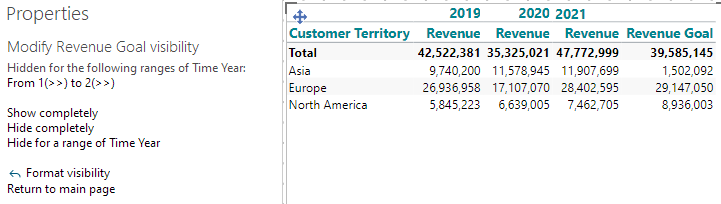
At first, I have simply hidden the Year Totals:
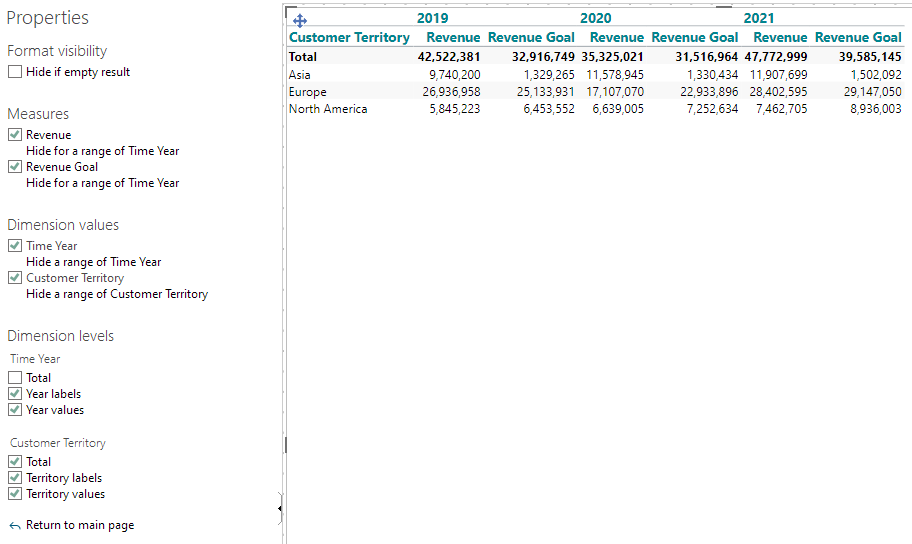
Then, Hide for a range of Time Year for my Revenue Goal Measure:

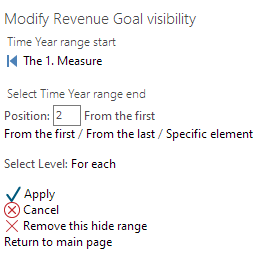
Here I simply keep it at "Position 1 from the first", and when I click "Define range end", I can then select that it should hide until Position 2:
And the result would be like this:
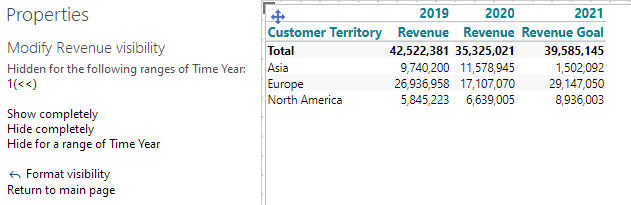
Let's assume that we would now like to hide Revenue for the last column. This time I will use the "Position 1 From the last" option:

If you click "Define range end", it should also read "Position 1 From the last" (because our hide range is just this single column). In fact, you can click "Apply" right away without going to "Define range end" when range start and range end are the same column.
The result from this:
Specific element
The two options "From first" and "From last" are both relative options, and they may be combined. E.g. in a 6 column crosstab, instead of hiding from "Position 1 From the first" to "Position 5 From the first", you may define it as "Position 1 From the first" to "Position 2 From the last".
When you click the "Specific element" you will be asked to "Click an element in the object". Notice: If you are working on a chart, you must use the "View data" option to see the crosstab behind before clicking an element.
Clicking an element will then use a specific reference to the clicked dimension member. This can be handy if your hide range should always be e.g. from "Product F" to "Product K" - this might include 6 products, but with other criteria it might include only 3 products.
Also, the "Specific element" is very often used when one specific dimension member should be hidden.
Select level
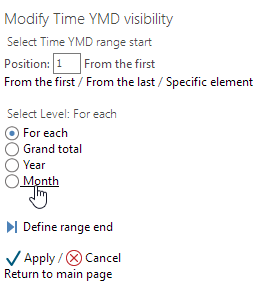
When working with Visibility settings for a multi-level hierarchical dimension, you must also consider on which level your settings should work.
In this example, I have a Year - Month two level hierarchy in my chart.
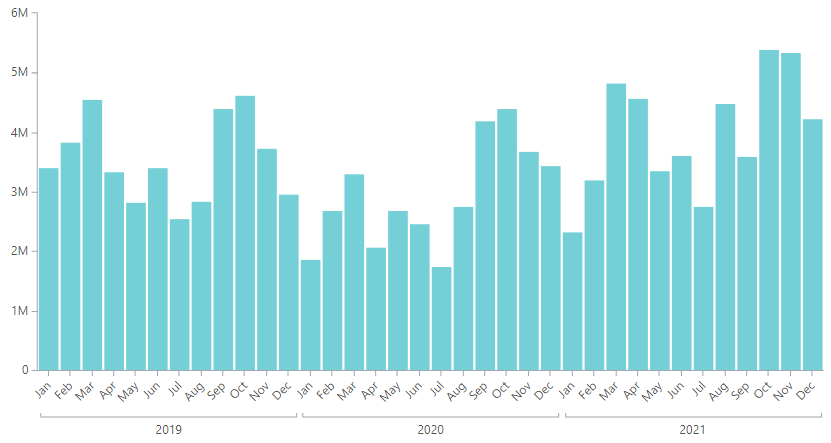
Assume that I want to hide the first 6 months (Jan-Jun 2019) from this chart.
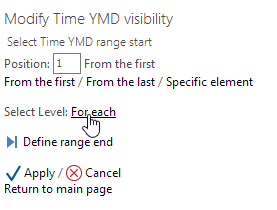
When I define my range start and range end, I must make sure that I am working on the correct level - the Month level. If I didn't do that, the Visibility setting would try to hide the first 6 Years as well.
Click the "For each" to change that to the proper level:
Having selected the Month level and set the range "Position 1 From the first" to "Position 6 From the first", the result will be like this:

Comments
How can I hide future months for all measures if 1 measure has no data?
I have :
1 forecast measure with data for all months in 2022
1 actual measure with data for currently only January 2022, but ofcourse that is changing with time passing.
I thus have a crosstab (simplified) with on row articles, columns are my months en data section with 2 months.
In the tabel I have a calculation: difference actual - forecast.
I only want to see this measure, thus set visability like this. (result table I have 14 columns; 1 article, 2 = total year, next 12 month columns).
I don't want to see the columns yet for Feb to Dec as I don't have actuals yet as months has not passed and I do not want to see the negative values of the differences.
But ofcourse if an article has not sold in January then I want to see the negative difference, only when total month actual =0 then I want to hide that month difference.
I tried different options, eg. with visibility agent and color agent to use an allcount function but I can't get the measure to use only individual column totals. Also this option of setting time range is not working as I have flexible time range during the year.
Maybe good to know as well is that this table could be exported to excel and in excel color agents to set font color transparent, are not really working, values are still there and transparncy is lost, so text are colored in white (if I set transparency on color white).
Hi Femke,
Assuming your Actuals measure is measure m1, you should be able to hide the values of your Difference calculation in this way:
This will return 1 (and show value) if m1 contains a value; it will return 0 (and hide value) if m1 is blank.
BR / Ole
Okay, so I have a situation where I have a Total calculation (sum(0, all(v), 0, 0)) as row from which I want to hide 2 cells:
These two cells are based on real measures from the cube.
How can I hide the values in these two cells?
Regards,
Dirk
Hi Dirk,
In your case, a visibility agent will not work on the calculated Totaal.
The easiest work-around will be to duplicate column 2 and 3 into two new calculated columns, e.g.
And then hide the original m2 and m3 measures.
If you don't apply 'Calculate in intersection' for the two new calculated columns, they will remain empty.
BR / Ole
Thanks Ole ;-)
Please sign in to leave a comment.