If you are a TARGIT customer, you have worked with cross tables.
Even though storytelling with KPIs, maps and graphs have minimized the number of tables, they are still there, very useful in many contexts.
Text rows and formatting members
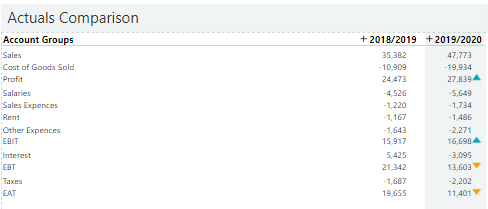
Let’s say that you are setting up a close income statement, and you’ve managed to get this far (maybe using user dimensions and calculations):
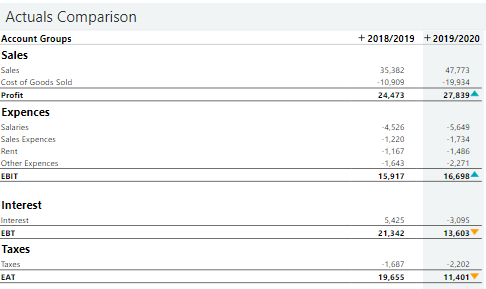
This is hard to overview, but by using text rows and formatting members (rows) – you can quite easily improve the layout to become like this:
Watch this video on how to transform the first table to the second one:
Comments
Please sign in to leave a comment.