The formatting options for titles, labels and mouse over allows you to show detailed information about the data behind the objects but still keep a tight analysis design.
You can also add Dynamic content to titles of graphs and crosstabs, using the Advanced Text Editor.
General
All the formatting options can be found in the properties for the individual object. Right click the object to get access to the properties.
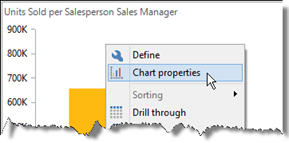
The properties are very similar and uses drop-down menus. The number of “default” options varies from object to object. You can also open a text editor for more advanced formatting. We will walk through all three subjects in this demo.
Titles
In the object title, you can insert the measure option. This will change the object title dynamically if you use the measure selector in the analysis.
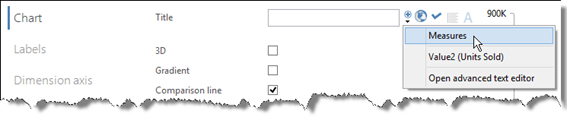
The title can be translated and the font formatted if needed.
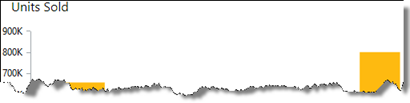
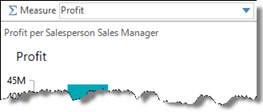
Now, add the measure selector to the criteria bar and see what happens when we change the measure.
We can refine the title so that it shows the measure name, the grand total for the measure and perhaps an average.
Click the small drop-down arrow to open the advanced text editor.
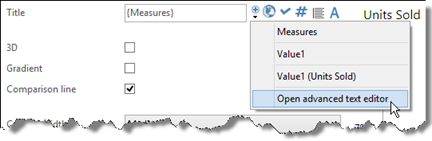
Place the cursor to the right of {Measures} click the drop-down arrow again (now called the 'Add value placeholder' button) and select <New numeric value>
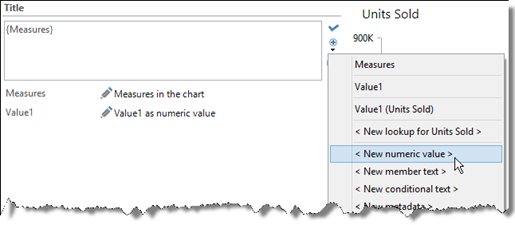
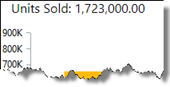
Now we have added a new value to the title. This value can be used in different ways but we just enter a simple calculation column.sum that calculates the total units sold.

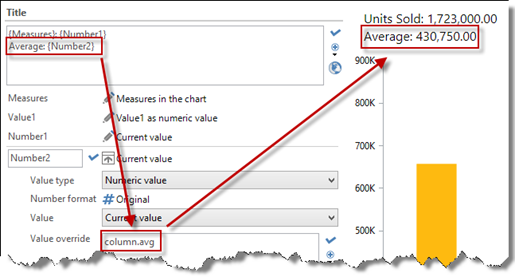
There are a number of different calculations. The most useful will typically be average (avg), total (sum), minimum (min) and maximum (max) calculations.
E.g., this is how to add an Average function:
Labels
The settings for showing labels are the same apart from the options for placement and rotation.
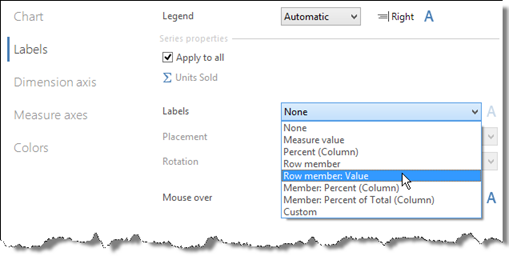
This default option will show the result below. The dimension value and the measure value are shown for each column. 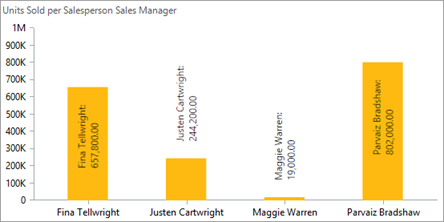
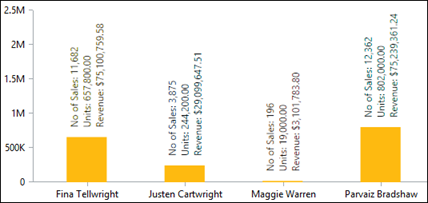
In the next example we add No of Sales and Revenue to our chart. The only reason for this is to be able to show the values in our labels, so we hide these measures through Properties / Visibility

In the drop-down, click Custom and then Open advanced text editor.
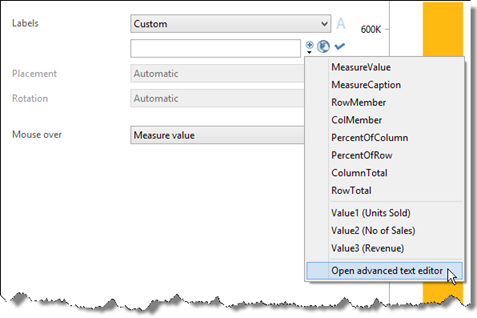
We can use a fixed text as a prefix followed by the appropriate values {Value2}, {Value1} or {Value3} in whatever order you like.

Comments
Please sign in to leave a comment.