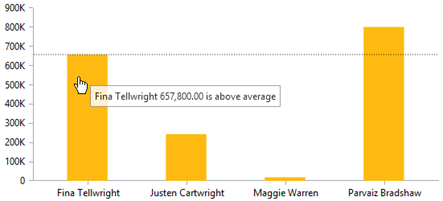
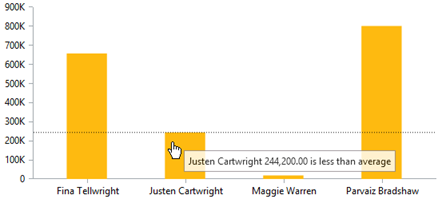
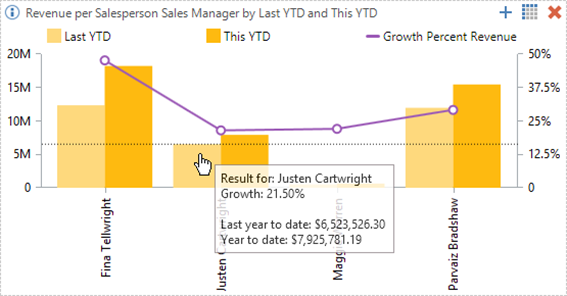
When you place your mouse on a dimension value in a chart, you can get more or less detailed information as shown above, so we are going to look at a few advanced options.
One option could be to show if Units Sold for the managers is above or below the average Units Sold.

Open the advance text editor again.
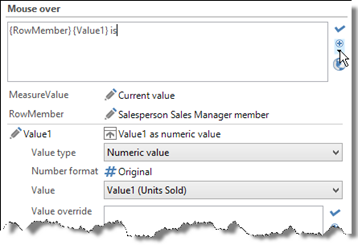
We can combine placeholders for values with fixed text. Here we use two placeholders from the drop-down list, {RowMember} (Sales Manager) and {Value1} (Units Sold) and a fixed “is”.
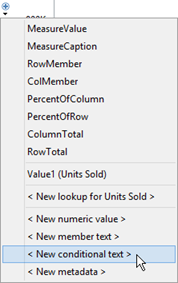
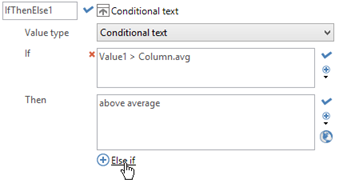
Now we insert a conditional text (If – Then – Else). Click the drop-down arrow and select <New conditional text>
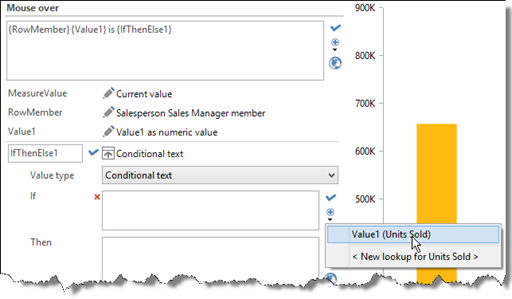
Remove the number 1 in the “if” statement box and select Value1 in the drop down menu.
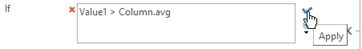
Then enter the formula for testing if Value1 (Units Sold) is greater than Column.avg (Average). Next, click Apply.
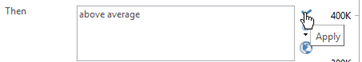
Enter the text in the “Then” box. Click Apply.
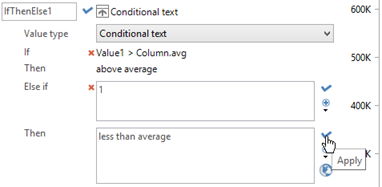
Next, click Else if to enter a text for the values that are less than average.
Now enter the text “less than average” and click apply
Next, we create a new cross table with a comparison and a calculation in it.
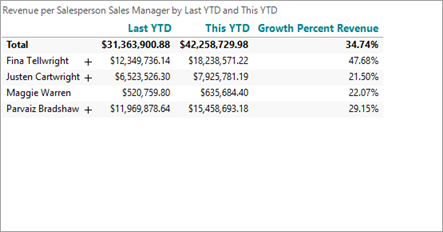
With a few adjustments, we get a result like this:
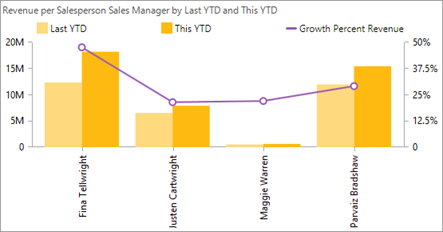
We want our mouse over to show combinations of fixed text and values for our comparison, our growth calculation and our dimension values.
We open the advanced text editor right away:
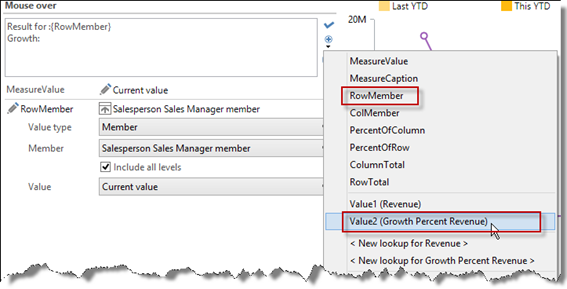
We type “Result for:” and select {RowMember} (Sales Manager).
Nest, we type “Growth:” and find {Value2}, which we can see from the drop-down, is Growth Percent Revenue.
We type some more prefixes “Last year to date:” and “Year to date:” and finally find <New lookup for Revenue>
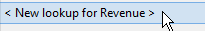
We select this lookup twice and get the following result:

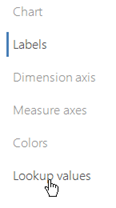
When we added the first lookup value, we got an extra tab in our diagram menu:
The Revenue1 placeholder should point at the column with data for last year to date. The data is in the first column if we look inside the cross table.
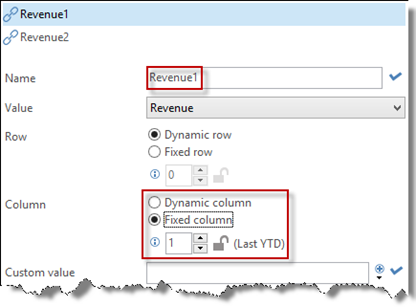
Revenue2 should point at column2 which shows the data for this year to date.

Comments
Perfect explanation except I can't seem to select any columns data unless the column is visible. e.g.
Lookup values
Revenue1
Value Drop Down - doesn't list column if is not visible.
I made the column visible and added OK and then added to mouse over but then when I make the column not visible the mouse over changes.
Please sign in to leave a comment.