Here we will work with calculations as a new measure and referencing a certain dimension value.
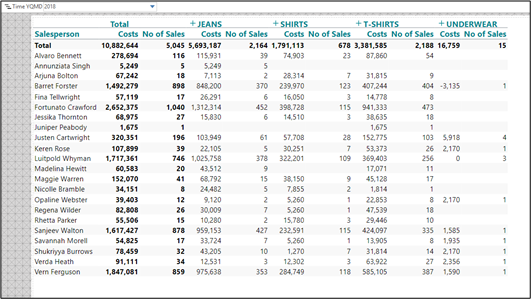
- Create a new Cost analysis with a crosstab showing Costs and No of Sales per Salesperson and by Product Hierarchy(Product group).
- Add global criteria Time = 2019.
- Add a calculation (as a new measure):
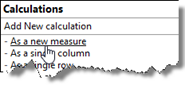
Costs per Sale = sum(0, 0, m1) / sum(0, 0, m2)
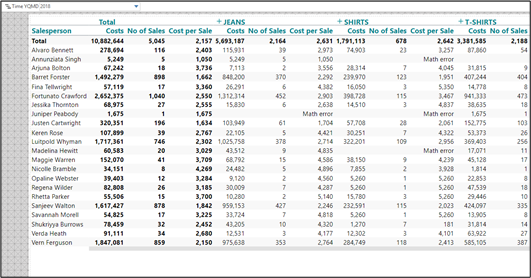
We have now added a new measure which can now be referred to if needed (in this case as m3).
Notice that when using calculation as a new measure you normally do relative referencing – we relate to the current column and row.
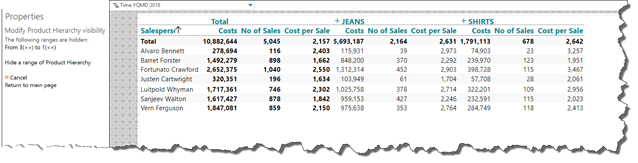
Now, the crosstab looks like this:
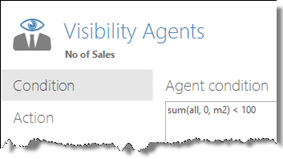
- Use visibility agents to hide all salespersons who had a total No of Sales less then 100 during the period.
The condition for the visibility agent looks like this:
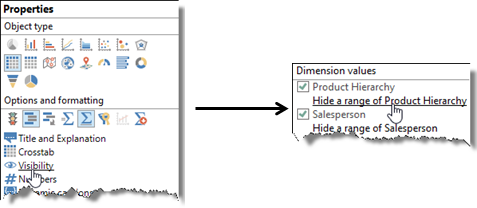
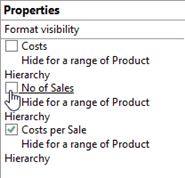
Use the Visibility formatting to hide the Underwear and T-shirt numbers.
- Go to Properties and Visibility and choose hide a range of Product Hierarchy.
- Choose Position 3 from the first – and Define range end – choose Position 1 From the last – click
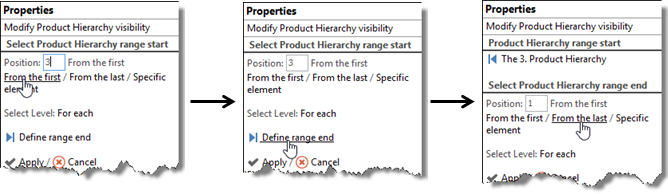
This will hide the last two columns of the cross tab and the resulting cross tab should now look something like this:
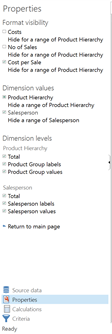
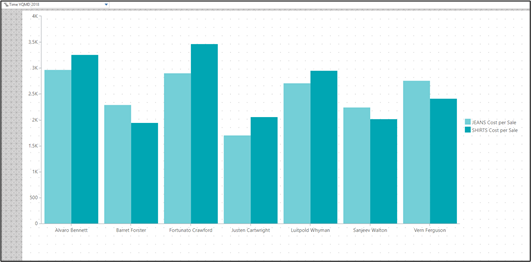
Hide No of Sales and Costs using the Visibility formatting and change object type to Column chart.
With a little further formatting, the result should look something like this:
Comments
Please sign in to leave a comment.