In this example, Budget and Revenue are the only two measures in the crosstab - m1 and m2 respectively. Also, we have a Time dimension - on the month level - along the vertical axis of the crosstab.
The scenario is, that we are at the end of September 2021, looking back at the Revenue achieved so far, compared to Budget of the full year.
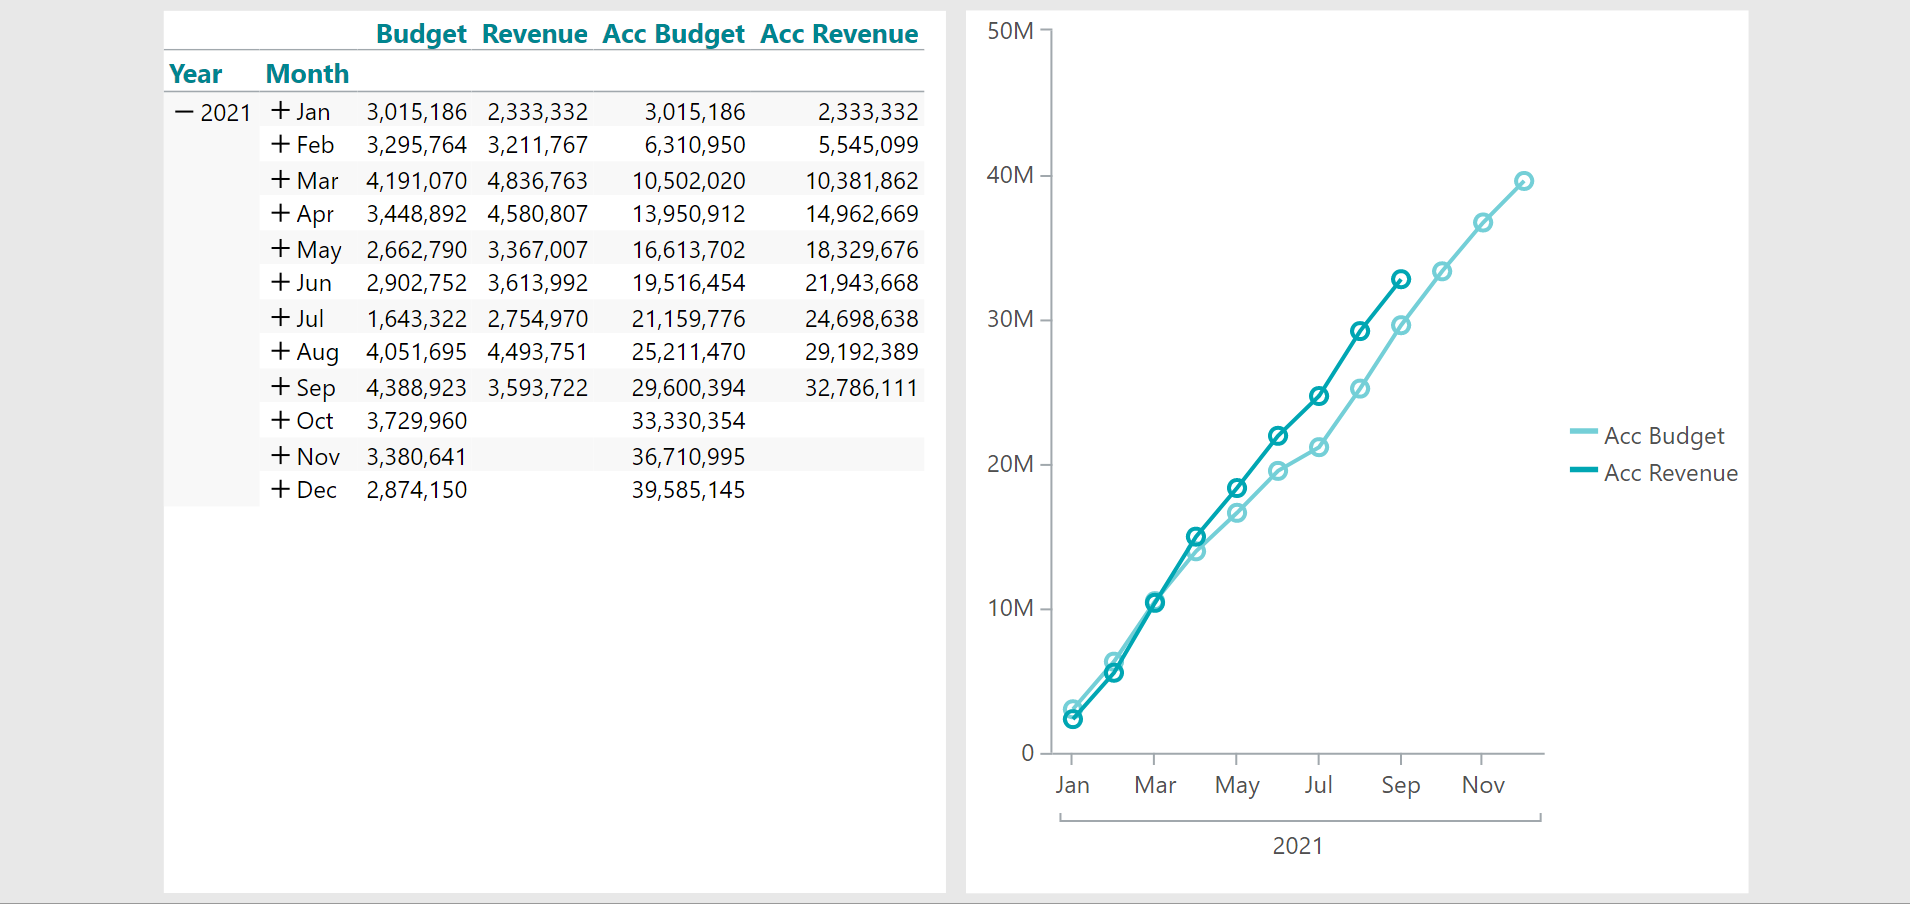
The two calculations, 'Acc Budget' and 'Acc Revenue' are both added as calculated columns to the crosstab.
Acc Budget:
sum(d1, d1:0, m1)
Acc Revenue:
sum(d1, d1:0, m2)
In both calculations, the 'accumulation' comes from the row reference of 'd1:0' - which means that each calculated value is calculated as the sum 'from the first row to the current row'.
The line chart is a copy of the crosstab turned into a line chart. Furthermore, with the Visibility option from the Properties Smartpad, the two original measures have been made invisible (unchecked).
Comments
Hi Ole,
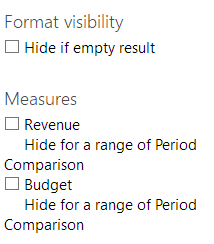
I can't find the "Hide if empty result" check box when I want to make a nice Akk..sum. We use Targit 2022.11.29002
Best regards Jette
Hi Jette,
I presume you want to hide the 2023 Akk.sum when there are no more values in the other column?
You will need to add a 'Visibility agent' to your Akk.sum calculation in the line chart.
Note that I cannot tell from your screenshot whether you are using measures, calculated measures or calculated columns. In my example below, I have one measure (No of Sales) and one calculation (Akk sum) added 'As a new measure'.
Table on the left is what you have. Table on the right is what we want to achieve:
I have taken these steps:
Viewed as a line chart (No of Sales measure has been hidden):
BR / Ole
Hi Ole,
Thats perfect - thanks a lot :-) It works for me now ..
BR / Jette
Hi Ole,
Is it possible to create a accumulated sum on calculated values, i.e. C1?
Best regards,
Kim
Hi Kim,
Yes. That should be possible indeed.
E.g., if you added a calculated column: avg(all, 0, m1), then you can create an accumulation like this: sum(c1, d1:0, 0)
BR / Ole
Please sign in to leave a comment.