If we create at a crosstab based on Profit per Customer Country (attribute) and by Time Year (from the Sales cube), we should end up with a crosstab with 14 rows and 4 columns (not counting the Total row/column) like this:
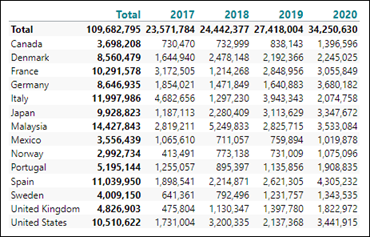
This crosstab, with the reference synatx in mind, can be broken down to:
- Columns: Years, d1 to d4 – or d-1 to d-4 (if counted from right to left).
- Rows: Countries, d1 to d14 – or d-1 to d-14 (if counted from bottom to top).
- Measures: Profit, m1. This crosstab contains only one measure.
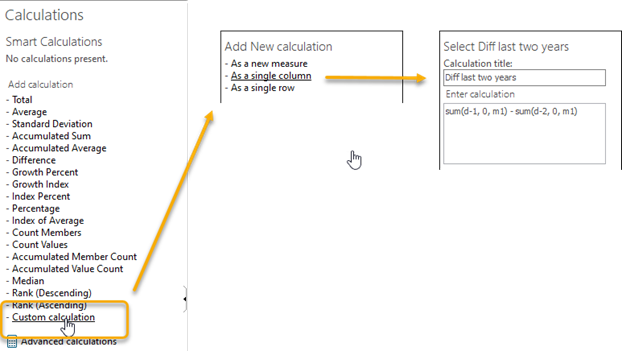
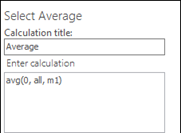
To calculate the difference between e.g. the last two years, we can do this with a Custom calculation:
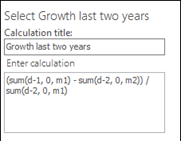
We could also add an extra calculated column, Growth last two years, like this:
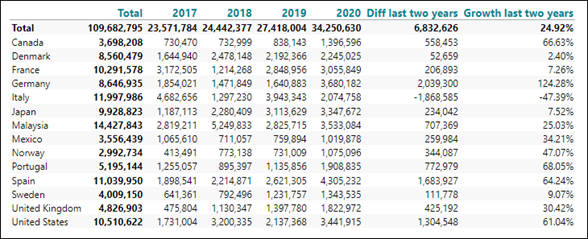
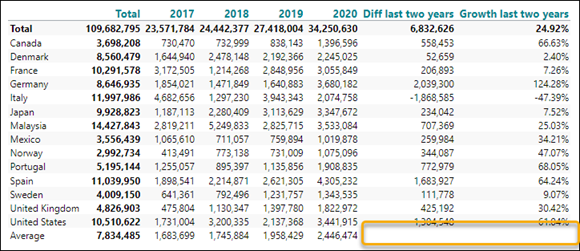
With Growth number formatted as Percent we should end up with a result like this:
Furthermore, we could add an average calculation for each year like this:
With the average calculation included, we should get a result like this:
Notice the two blank cells in the intersection between the calculated columns and the calculated row. They are blank simply because TARGIT does not know if you prefer to calculate an average for the diff and growth valuesor if you prefer to calculate a diff and a growth for the average values.
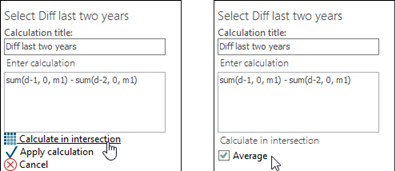
Supposing we decide to calculate the diff and the growth for the average values, we should re-open the the Diff and the Growth calculation to make sure that the Average is included in the Calculate in intersection setting:
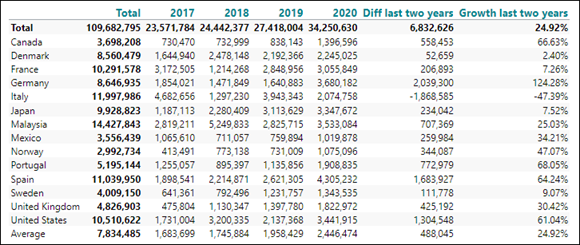
In this way, we will eventually get to a result like this:
Comments
How do I change the order of the columns? I need a calculated field between 2 measures.
Hi Jora,
For calculations that have been added as 'Single column' or 'Single row', you can just drag and drop the calculation into its proper place.
For calculations that have been added 'As a new measure', the calculated measure will always come after the original measures. If you need such a calculated measure to come between two original measures, you will have to follow this approach:
In this way it will appear as if the new calculated measure is between the two original measures.
Best regards,
Ole
Thank you!
Hi
Is there a way that I can create a custom calculation to concatenate the string values in two columns (dimensions)?
Eg:
A row with Item Code as 1 and Item Color as Red should show up as a new column with 1:Red.
Thank You
Hi Stevan,
Client based calculations can only work on numeric values and produce a numeric result.
String manipulations should be done in the data warehouse, where you would use a concatenate function to produce the new column in the source table.
BR / Ole
Olá, tudo bem? Tenho uma dúvida.
Existe alguma forma de somar colunas de tabelas cruzadas diferentes dentro de um mesmo layout no TARGIT? Por exemplo: gostaria de somar os pontos da primeira tabela com os pontos da segunda tabela, mas cada uma possui critérios e dados cruzados diferentes.
Há alguma maneira de realizar essa soma, mesmo com essas diferenças de estrutura?
I Google translated the comment:
Hello, how are you? I have a question. Is there any way to add columns from different cross tables within the same layout in TARGIT? For example: I would like to add the points from the first table with the points from the second table, but each one has different criteria and cross data. Is there any way to perform this sum, even with these differences in structure?
The short answer is: To do calculations in the TARGIT client, the required data needs to be in the same object/crosstab. You cannot do calculations across two or more crosstabs.
BR / Ole
Please sign in to leave a comment.