This dashboard was created for our maps visualization contest and it contains a lot of tips and tricks that really can help you in your daily work creating dashboards with TARGIT.
This tip - based on this dashboard - is around using crosstab themes in a creative way to show bonus info.
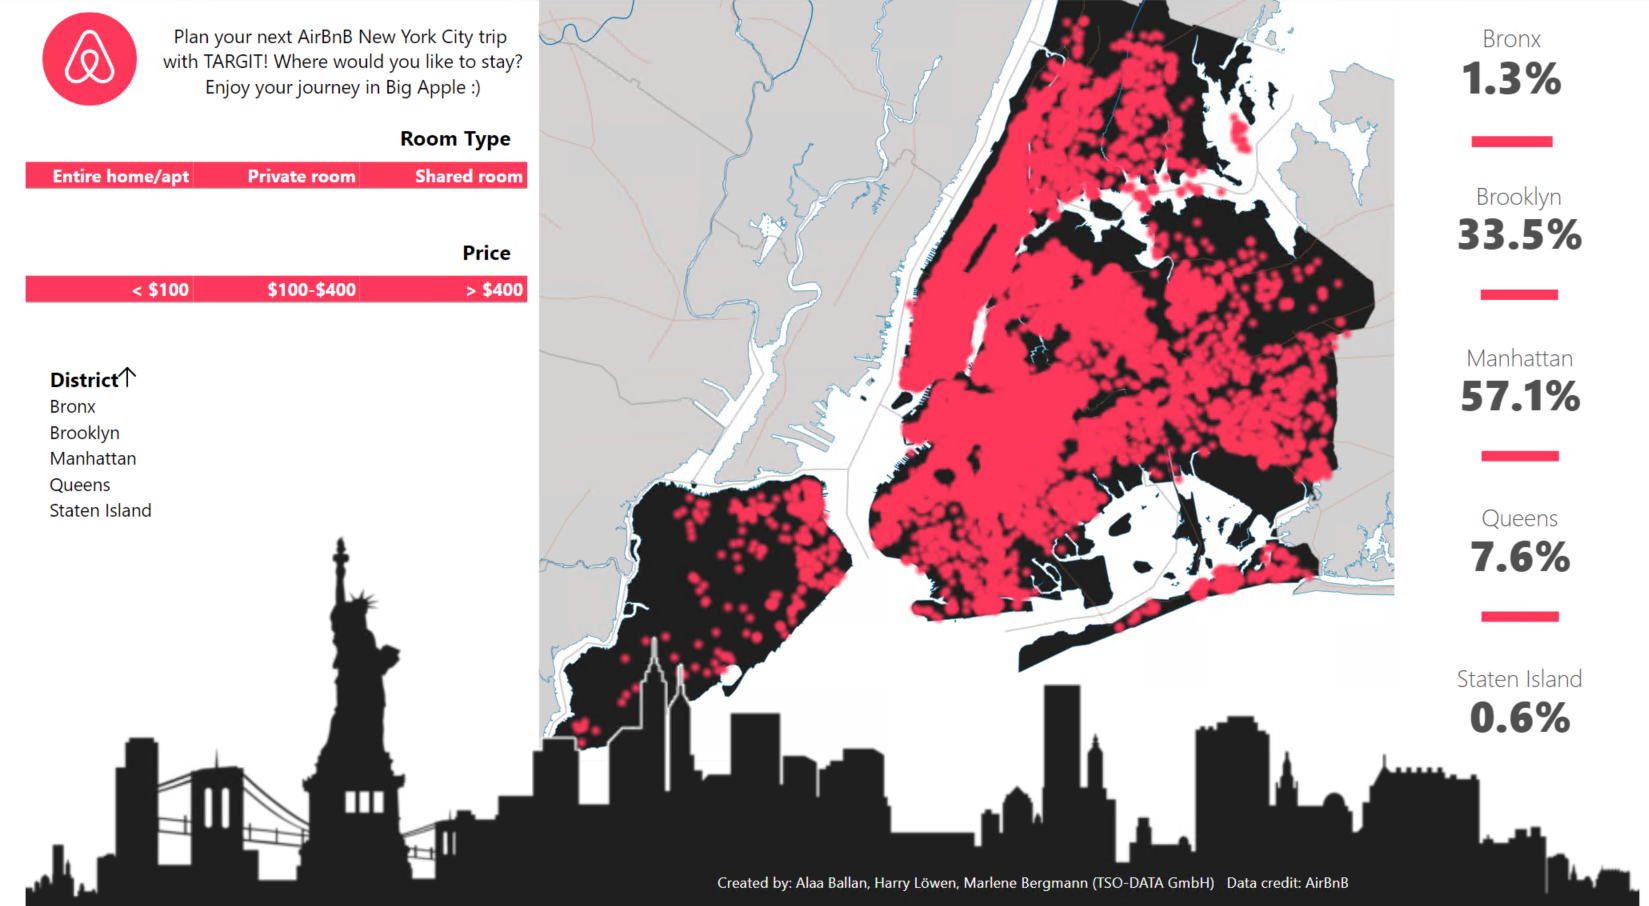
Authors of this Dashboard: Alaa Ballan, Harry Löwen, Marlene Bergmann from TARGIT partner TSO-DATA (GmbH)
Note: Data for the dashoard is provided by AirBnB
The 2 red lines in the upper right corner of the dashboard are actually 2 crosstabs with a dimension on the horizontal axis and a measure that remains hidden until you click one the dimension values.
To the end-user it presents him or her with some bonus-info when they click one of the dimension values - e.g. if you click Private Room it gives you the average price of a private room - and of course also filters the dashboard to show only private rooms.
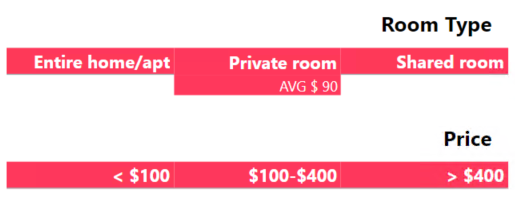
So - the numbers were there all the time - but how where they hidden from us until Private Room was clicked?
It was done by setting up a crosstab theme for this purpose - let's have a look at the theme:
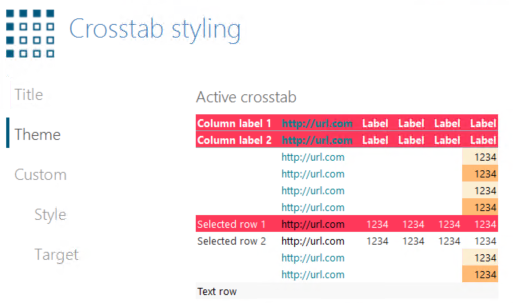
Notice the Selected Row in the crosstab theme. This is the crosstab version of the "drill color" that you can set up for all types of graphs - where you can decide on which color should indicate that a certain value has been chose.
In this case all values in the crosstab themes are white - which means they won't be visible on a white background - while the red background color on the selected row of the crosstab theme means that if you click the dimension value, the values suddenly get a red background and then becomes visible.
So with this trick you have created a small version of the TARGIT feature required criteria - just within the same crosstab.
Comments
Please sign in to leave a comment.