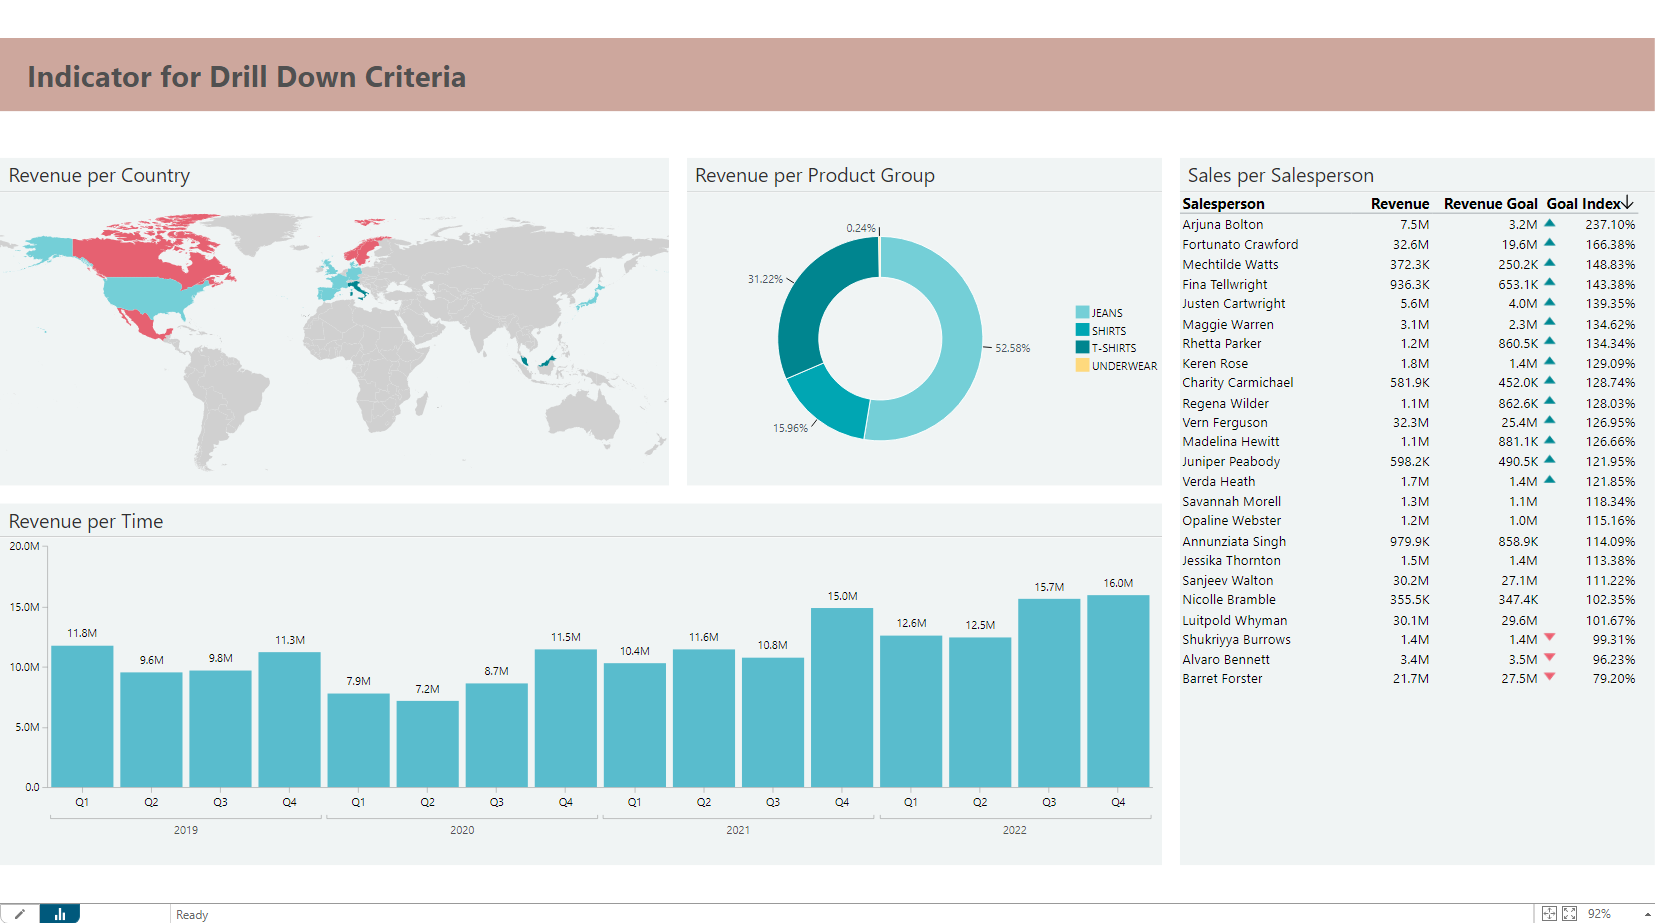
I have a dashboard that looks like this when no drill downs are applied:
And when I do a drill on any of the objects (the donut chart in this example), the dashboard looks like this (notice the yellow indicator in the upper right corner):
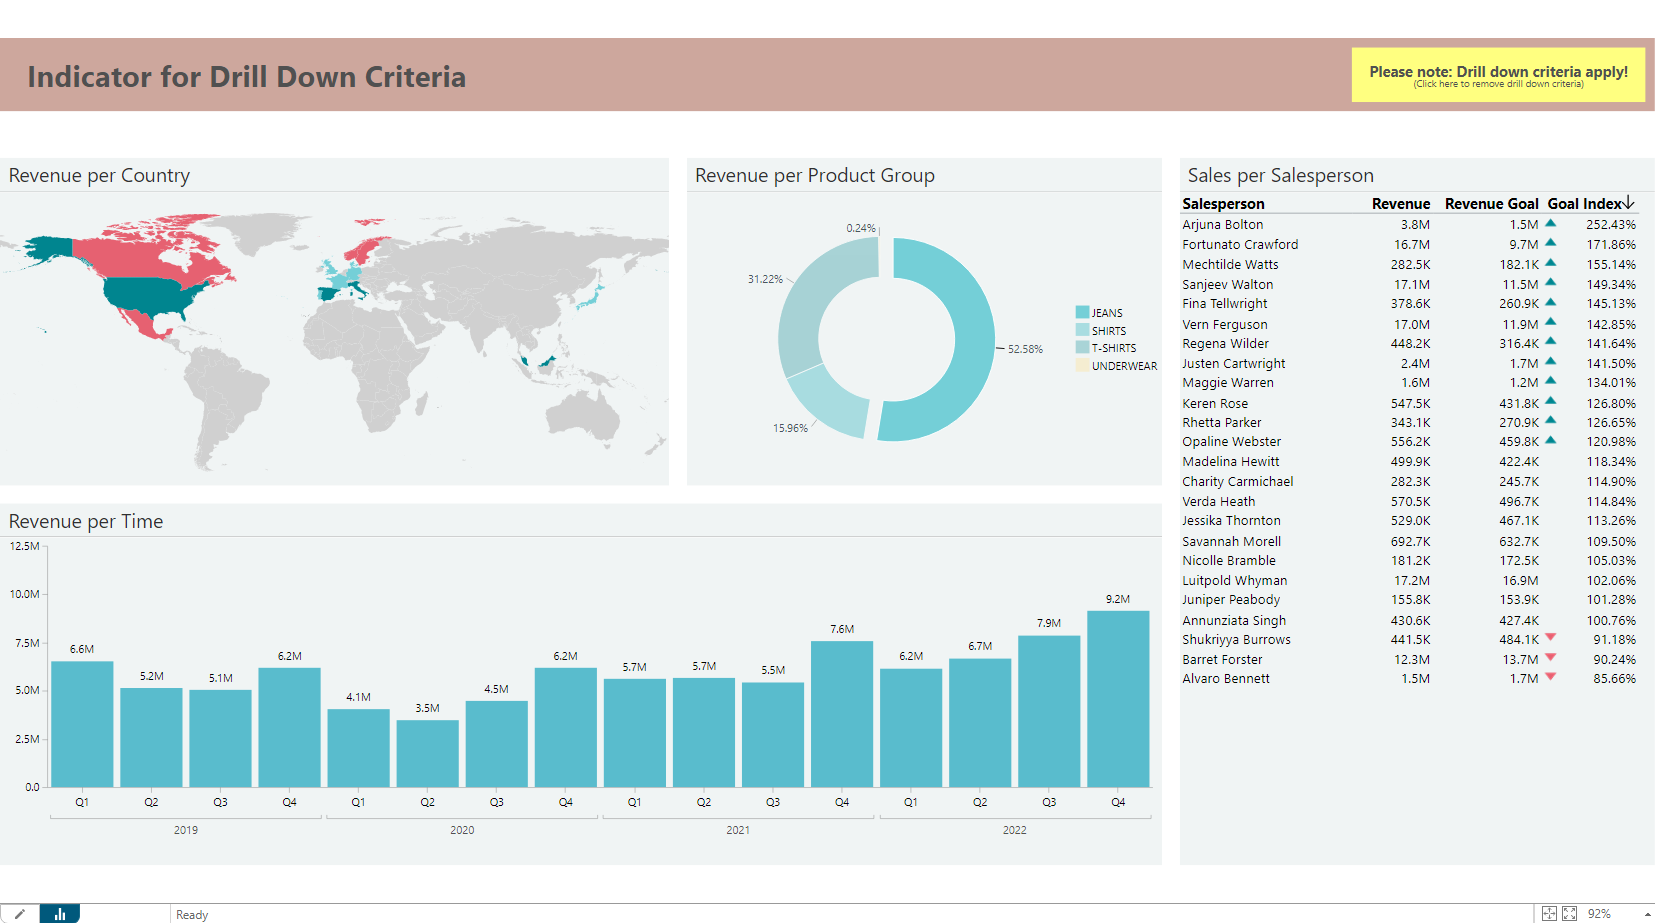
The purpose is to make it extremely clear to the end-user that drill down filters currently apply, and that data in some of the objects no longer reflects the full picture. Occasionally, I have heard of people working with wrong data sets - simply because they overlooked that a drill down filter from somewhere still applied to their data.
So, how did I do it?
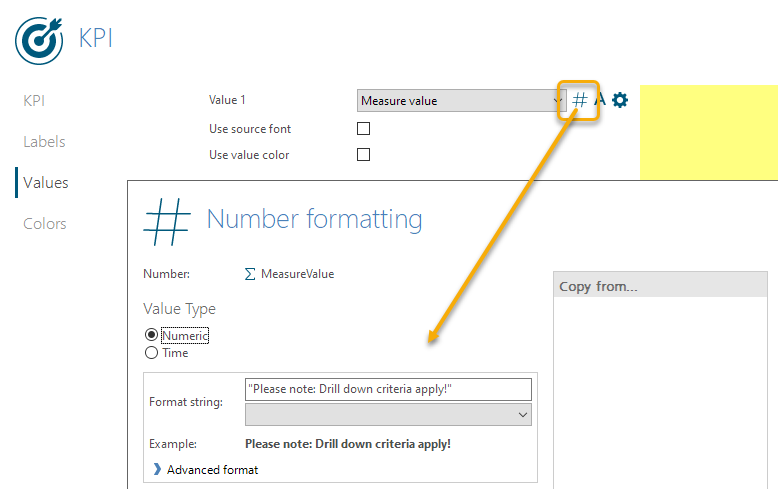
The yellow box is actually a KPI object that I have strongly abused to just display the desired text.
For instance, I have tweaked the number format of the measure value (you can use any measure) to just display text:
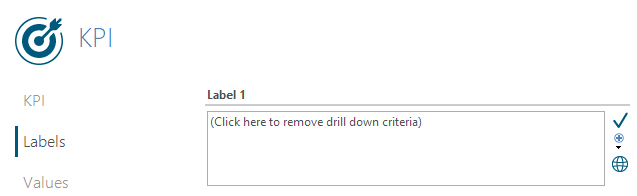
Furthermore, the Label has been set like this:
And finally, a background color has been added:
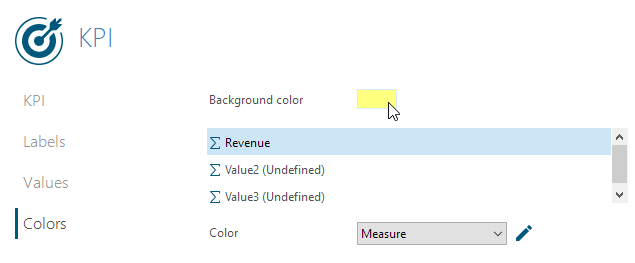
All of this will result in a "KPI" like this:

To make sure that this KPI will only appear when I make a drill down on e.g. the Product Hierarchy of the donut chart, I will apply 'Required criteria' (from the Criteria Smartpad) to the KPI object, and also make sure that it is hidden when no drill downs are applied:
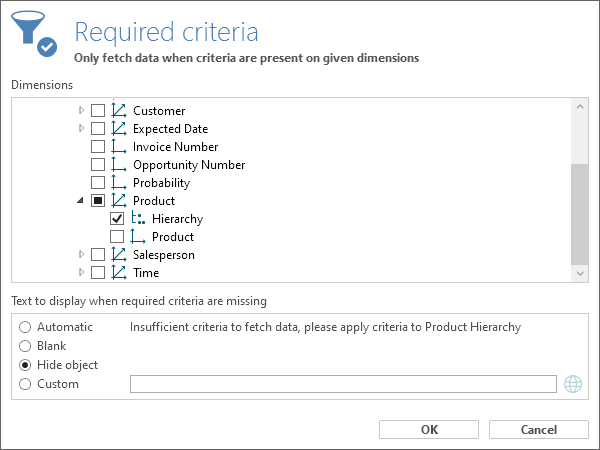
Next, I will copy the KPI object as many times as I have drill down objects (four in total in my example). Each copy will need required criteria settings according to the potential drill down dimensions. In my example, I will need to set required criteria for Product Hierarchy (which I already did for the first KPI object), for Country on the second KPI, for Time on the third KPI and for Salesperson on the fourth KPI.
All of these KPIs are placed in the exact same location (on top of each other) in the upper right corner of the dashboard.
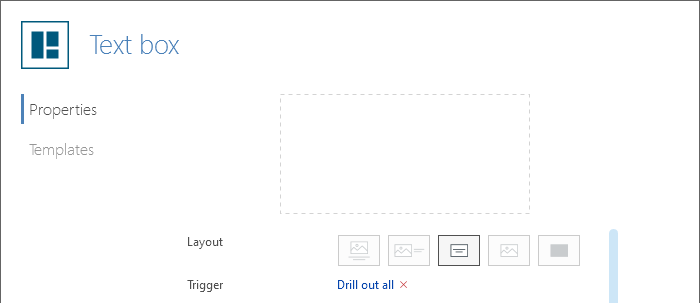
Finally, on top of the pile of KPIs, I place a Text box. An empty and transparent text box. The only purpose of this text box is to act as a trigger that removes all drill down filters:
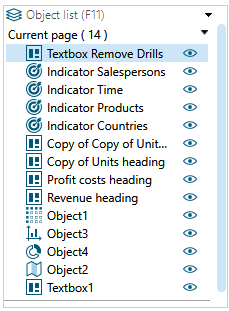
Notice: From your 'Object list' you can rearrange your objects to make sure that the Text box object goes on top of the KPI objects:
Comments
Please sign in to leave a comment.