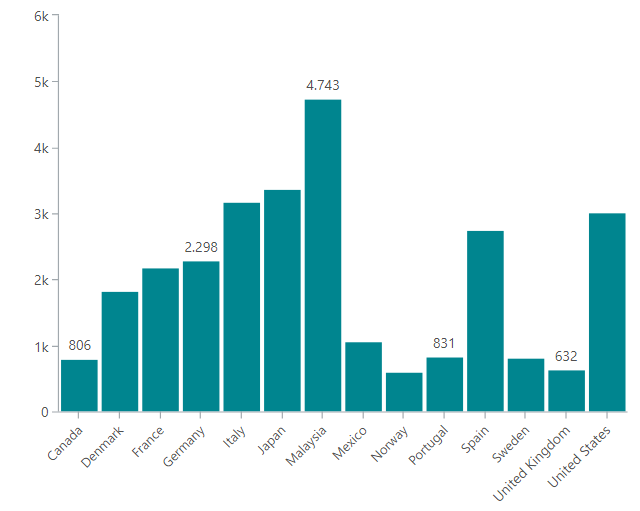
Here is a column chart with standard labels:
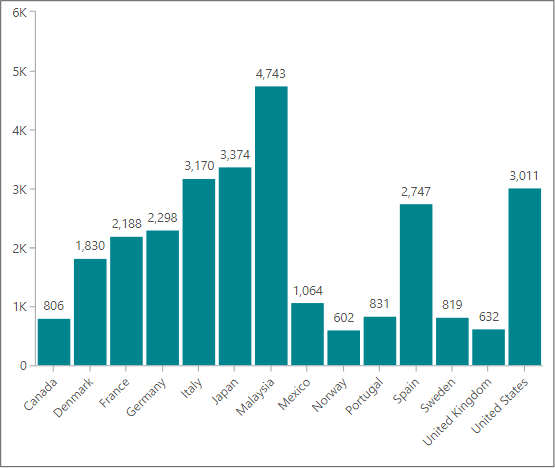
If you have a column chart like this, maybe you would like to apply the labels - not to all columns, but just to one column or a few selected columns.
I am going to do this by use of two TARGIT features:
- An added calculation that will return either '1' or '0'
- An advanced label - using 'conditional text' to show labels where the calculation equals '1'
Example 1: Label on last column only
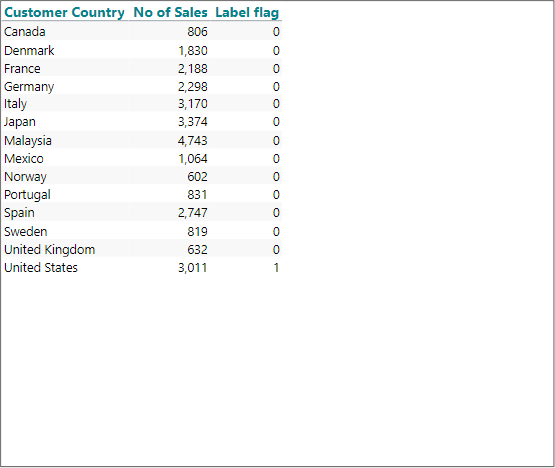
Calculation (Label flag), added as calculated column:
if allcount(d1, d-1:0, m1) = 1 then 1 else 0
The column chart, viewed as a crosstab would then look like this:
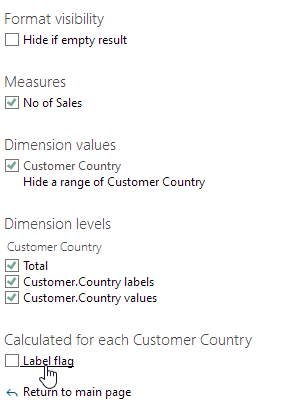
You might want to hide this calculation right away (from Properties / Visibility). Even if hidden, you can still refer the calculated values later on.
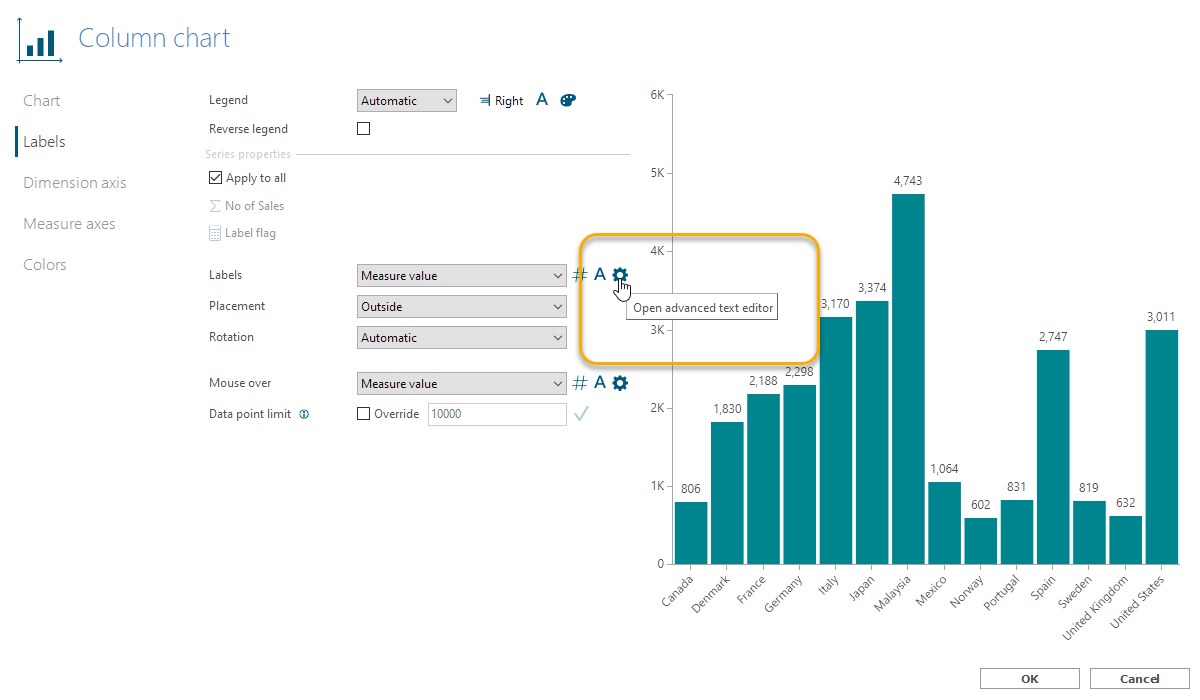
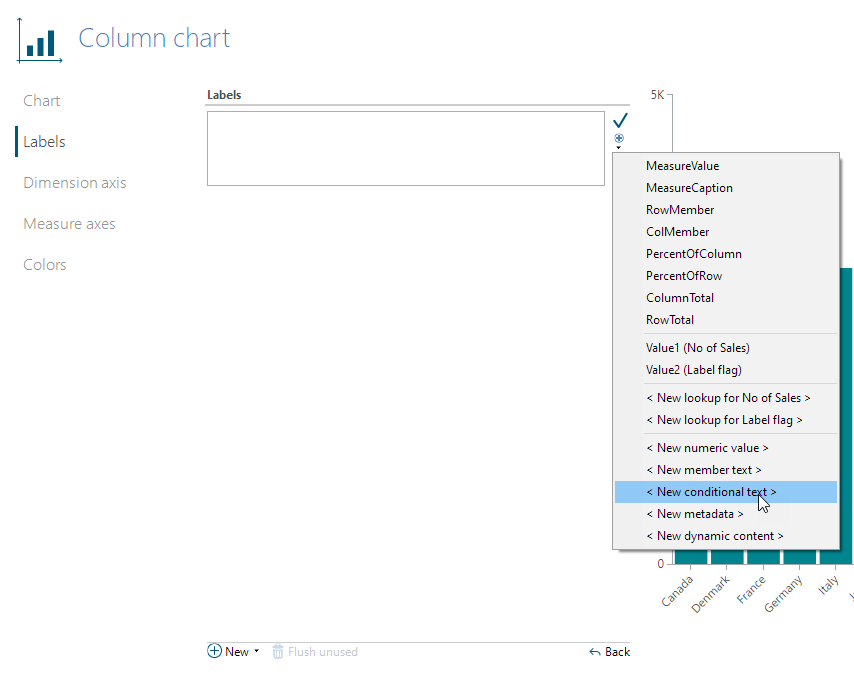
Next step is to start working with the 'Advanced text editor' for labels of the column chart:
Remove any content of the editor field and add a 'New conditional text':
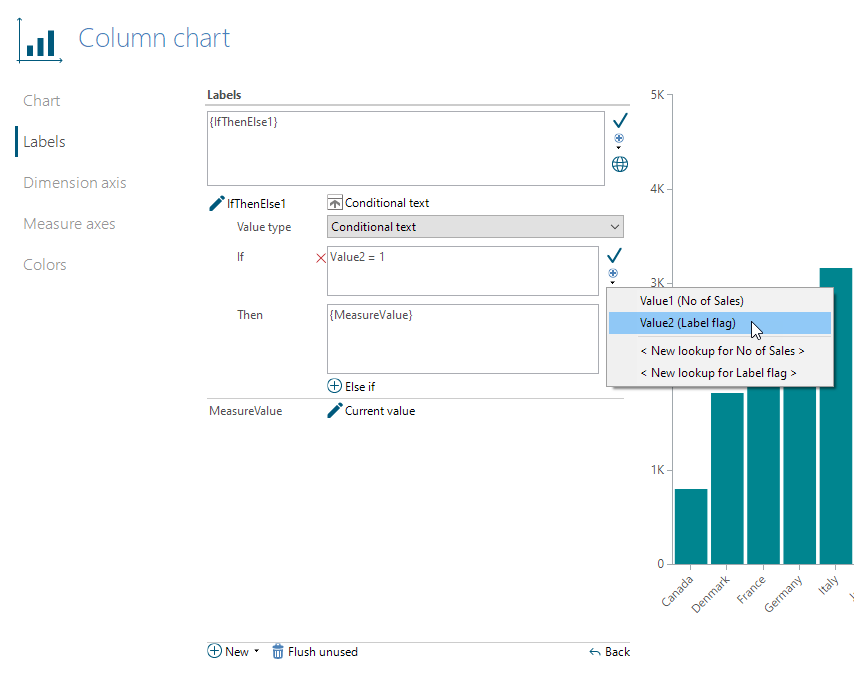
- In the 'If' box, add Value for the calculation - in this example, Value 2 (Label flag).
- Press the 'Apply' button next to the 'If' box.
- In the 'Then' box, add MeasureValue.
- Press the 'Apply' button next to the 'Then' box.
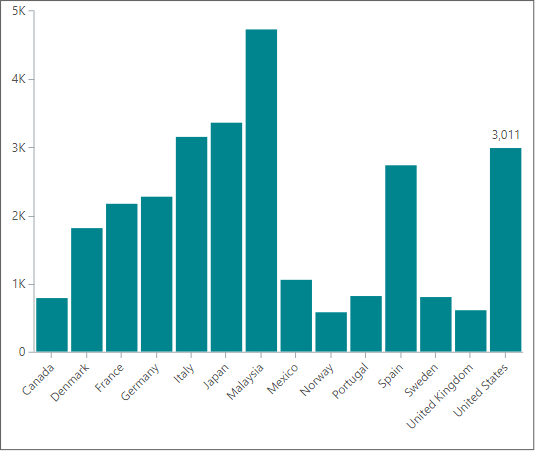
Now, this should result in seeing the label on the last column only:
Example 2: Labels on first and last column only
The nice thing about the previous preparations, is that now you only need to change when the calculation should result in '1' or '0' to apply labels on other columns of your choice.
To get labels on first and last columns only, change the Label flag calculation to this:
if (allcount(d1, d-1:0, m1) = 1 or allcount(d1, d1:0, m1) = 1) then 1 else 0
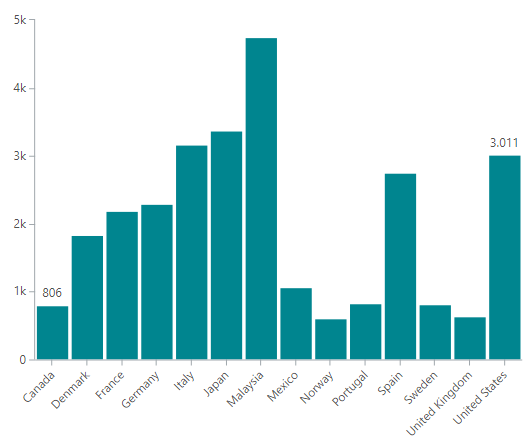
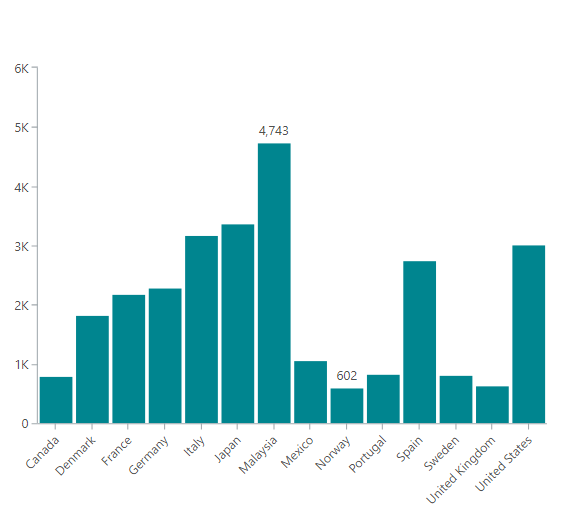
To get a result like this:
Example 3: Labels on every third column
mod(allcount(d1, d1:0, m1);3)
Example 4: Labels on highest an lowest columns
if (sum(d1, 0, m1) = min(d1, all, m1) or sum(d1, 0, m1) = max(d1, all, m1)) then 1 else 0
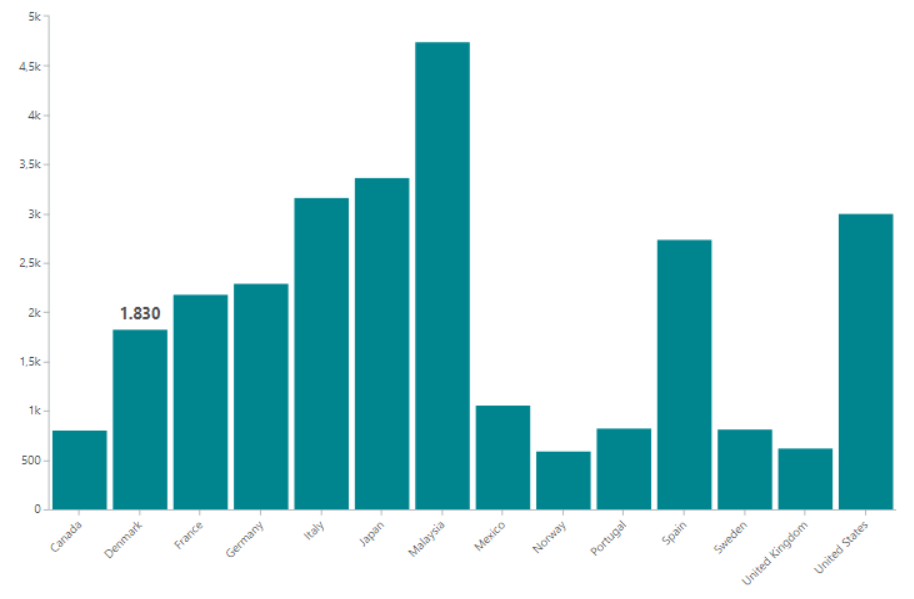
Example 5: Label on named dimension member
if allcount(d1, d1:0, m1) = allcount(d1, d1:@"[Denmark]", m1) then 1 else 0
Comments
Hi Ole,
I find this very useful, but I can't seem to get it to work on a calculated measure. If I use this: if sum(0, 0, m3) = min(0, all, m3) then sum(0, 0, m3) else 0 it comes back as undefined, if I use the same with m1 or m2 it works perfectly fine, it doesn't make a difference if I set the dimension to be d1 rather than 0 either. Any suggestions?
I have tried changing the formatting of m3 between numbers, percentage, multiplying by 100 to get a higher number in case it doesn't grasp the decimals, but that also does not help.
I tried:
if sum(0, 0, m3) = min(0, all, m3) then sum(0, 0, m3) else 0
if sum(0, 0, m3) = min(0, all, m3) then 1 else 0
if sum(d1, 0, m3) = min(d1, all, m3) then sum(d1, 0, m3) else 0
if sum(d1, 0, m3) = min(d1, all, m3) then 1 else 0
Hi again,
I identified the issue: It can use min/max if the measure is not a division.
It works if m3 = sum(0,0,m1) - sum(0,0,m2)
It does not work if m3 = sum(0,0,m1) / sum(0,0,m2)
Hmm... I can get it to work in both cases.
Could it be that with your data, sometimes sum(0, 0, m2) returns 0 - and thus you get a 'math error' (division by zero), which invalidates min(0, all, m3) ... ?
BR / Ole
Hi Ole,
I didn't notice that one of the 52 weeks did return an undefined calculation, and thus the whole column became invalid for the min/max calculation.
Thank you!
I did however find another work around, which also avoided the next issue as I wanted to see the week with the lowest amount that is not 0:
I added a column c5: if sum(c1, 0, m1) = 0 then 1000 else sum(c1, 0, m1) (to filter out 0 without removing or hiding them).
Then I added two agents:
Mark if value = max(0,all, m3)
Mark if sum(c5, 0, m1) = min(c5, all, m1)
Hey Ole Dyring, when you said, "You might want to hide this calculation right away (from Properties / Visibility). Even if hidden, you can still refer the calculated values later on."
Do you know if this was true in TARGIT 2019.6 build 17131?
When I try to follow your directions above, it doesn't work if the "Label Flag" is hidden with Visibility or a Visibility Agent.
I was able to workaround by unchecking "Show in Legend" under colors, but it still leaves a gap in the bar chart where the value of 0 or 1 is shown.
Please sign in to leave a comment.